Tech Salary Benchmarks for Employers 2026
Pave gives compensation and talent leaders real-time IT salary benchmarks by role, experience level, and specialization, with structured tools for building competitive pay bands across every IT job family.

Tech Salary Trends Shaping 2026 Pay Strategies
Technology compensation in 2026 is bifurcating. Pave's data across 8,700+ companies shows that the share of new software engineering hires rose from 19.32% to 22.77% between Q4 2023 and Q3 2025, but entry-level and junior software engineering fell from 19.2% to 13.9%. AI is compressing demand at the bottom while amplifying it at the top.
Compensation strategies built on blended averages are already out of date. The share of companies in Pave's dataset employing at least one AI Engineer grew from 2.7% in January 2023 to 8.4% by January 2026, a role category that barely existed in most salary surveys three years ago.
Pave's 2026 compensation budget data shows a 3.5% median salary increase across 243 companies, a tighter envelope that still needs to stretch across roles with very different supply-demand dynamics.
Where Pave's Tech Compensation Data Comes From
Traditional tech salary surveys are collected once a year and published six months later. Pave works differently: automated, persistent connections to HRIS, ATS, and equity management systems feed data continuously into Pave's database, which publishes refreshed benchmarks monthly.
Setup takes as little as 15 minutes. Machine learning handles job matching across 200+ tech job families, mapping records by level, career track, and reporting structure rather than job title strings alone.
- No stale data: Benchmarks updated monthly from live HRIS, ATS, and equity management system connections, not once-a-year survey submissions.
- Aggregated and de-identified: All data is anonymized before entering Pave's database. No individual companies or employees are identifiable in published benchmarks.
- ML-powered job matching: Eliminates manual matching effort across 200+ tech job families and ensures roles are benchmarked against genuinely comparable positions.
Stop Benchmarking Tech Salaries With Outdated Data
In an industry where AI Engineer demand tripled in under three years, the gap between annual survey data and actual market rates is widening. A New Era in Compensation Benchmarking breaks down what is driving the shift to real-time data and what it means for technology compensation teams.
- Where traditional compensation surveys fall short for technology teams, and why the lag problem is getting worse, not better
- How real-time market data, powered by automated HRIS, ATS, and equity management system feeds, is transforming tech compensation decisions
- What is holding compensation teams back from making the shift to live benchmarking, and how to build the internal case
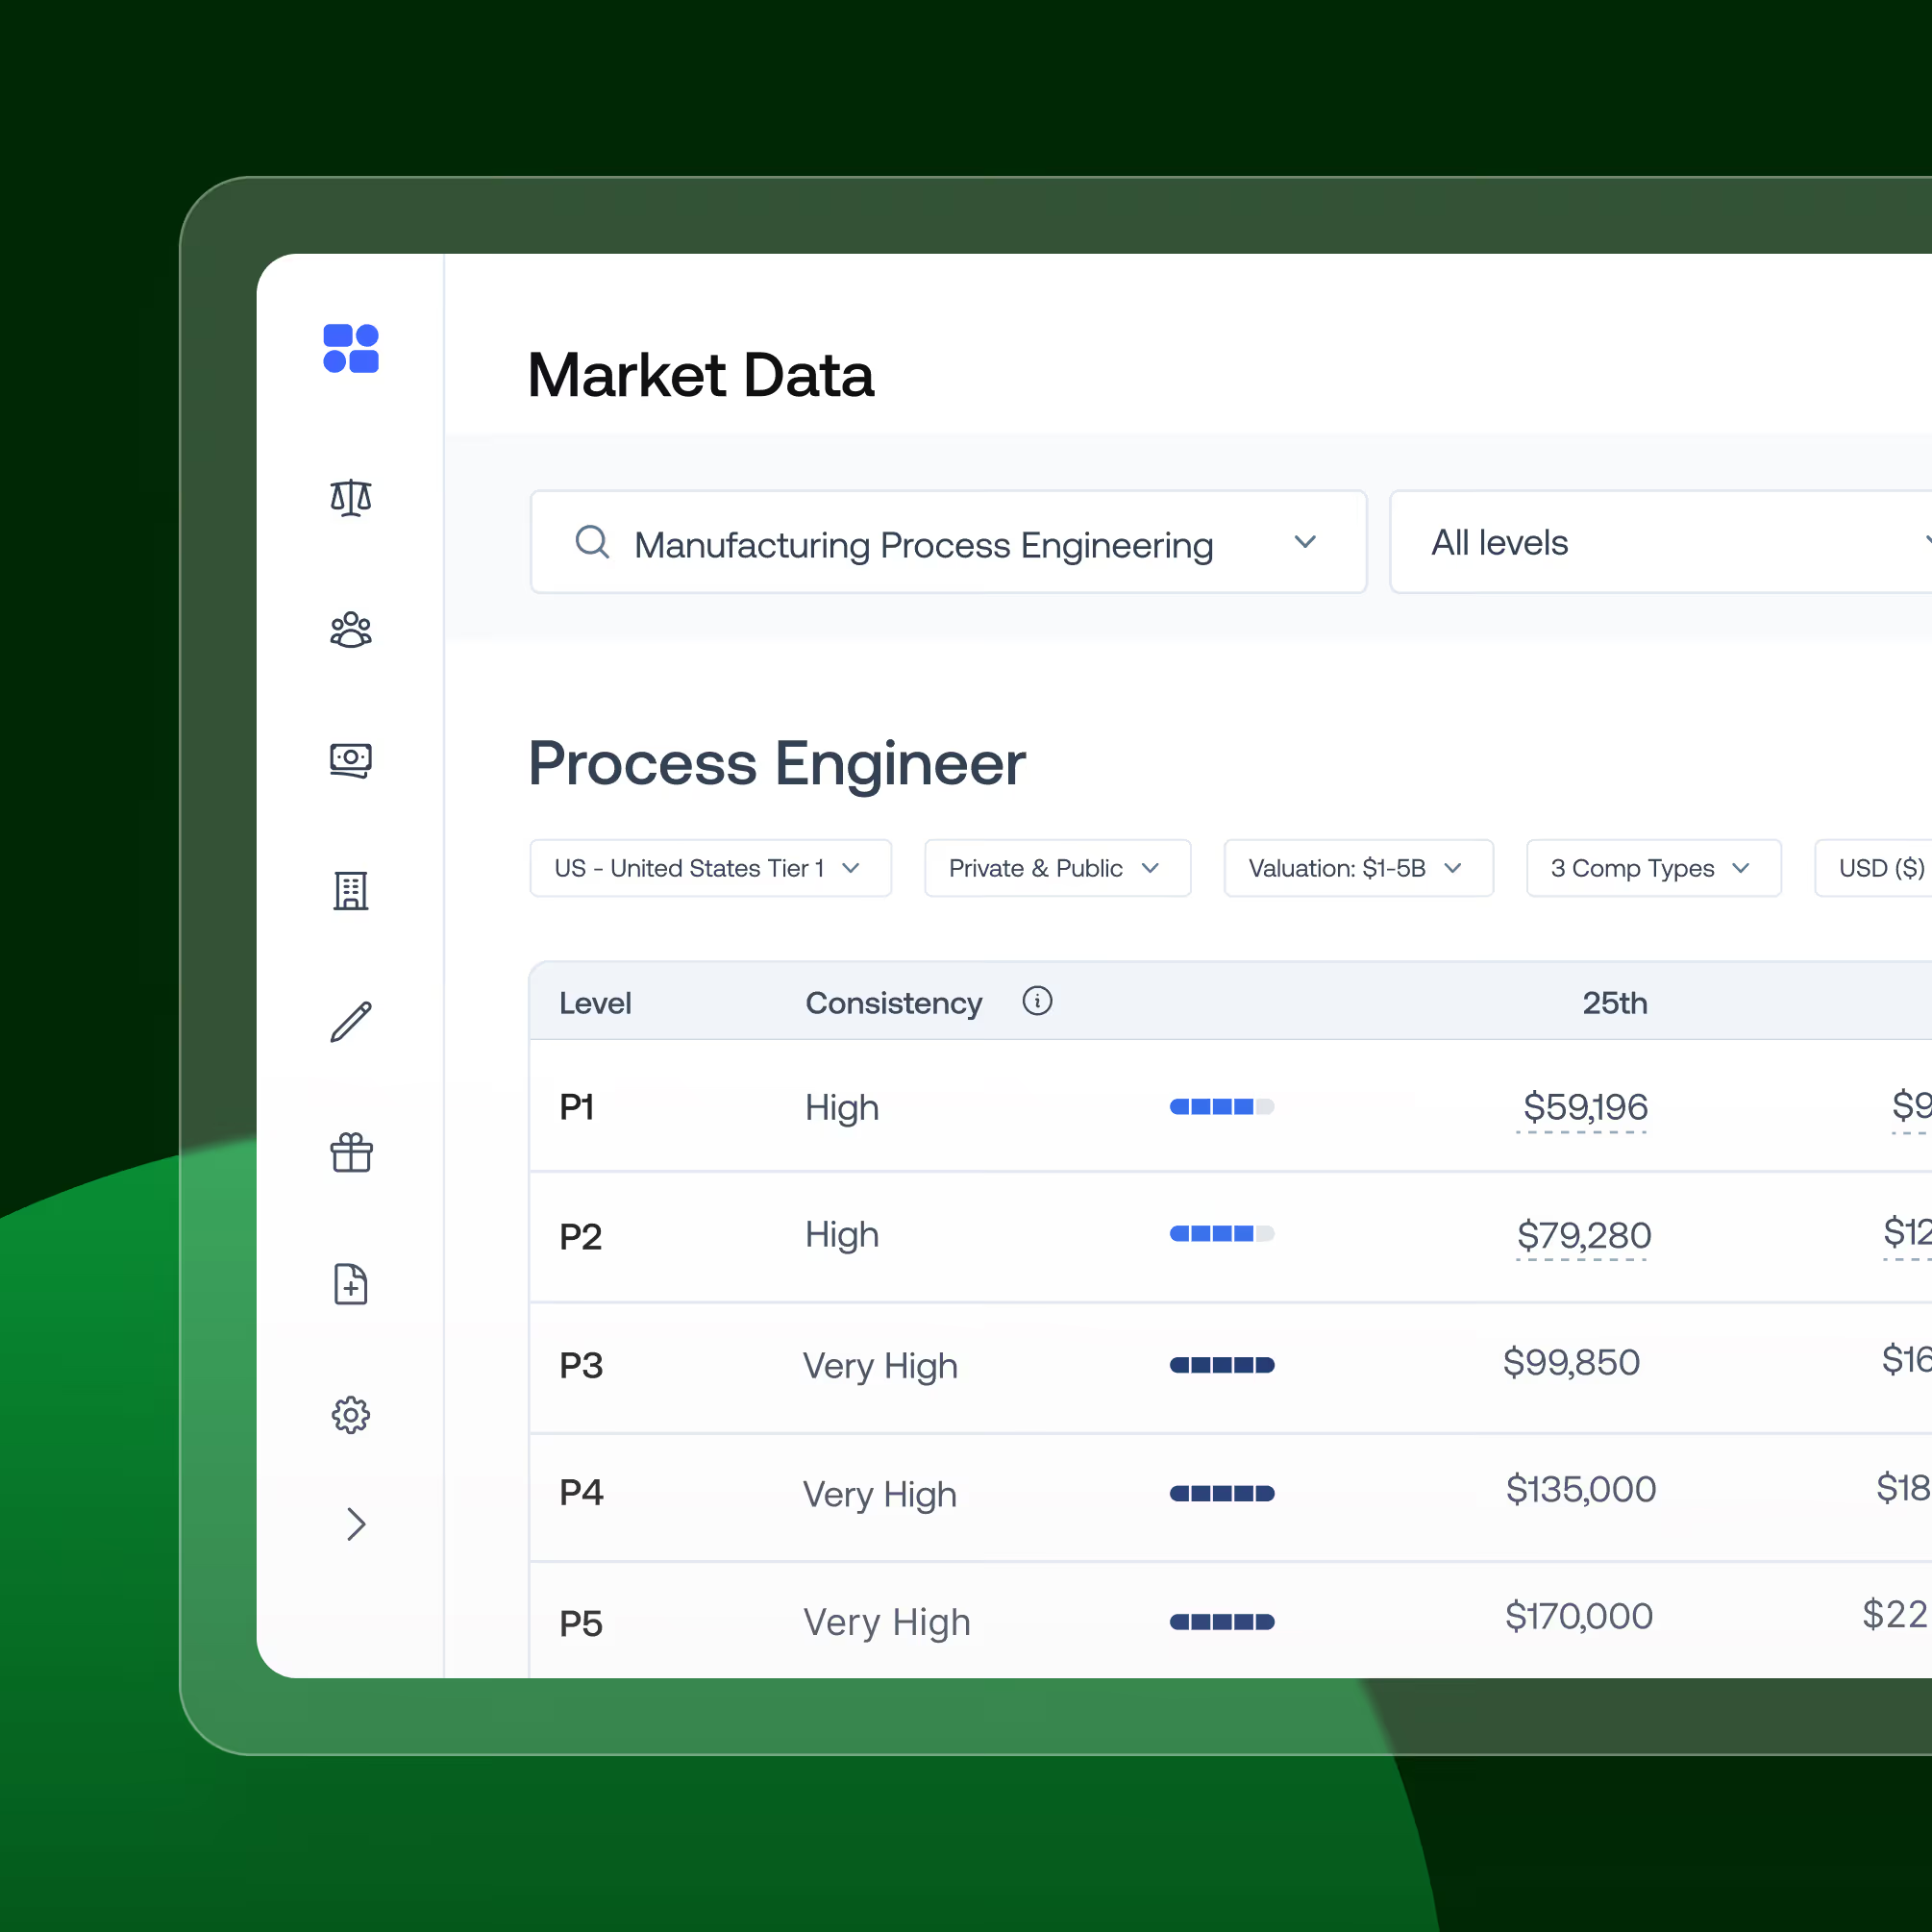
Annual Tech Compensation Growth Trends
Role category, experience level, tech stack specialization, and remote vs. on-site location produce materially different salary trajectories. A single merit percentage does not translate evenly across engineering, data, and product.
Software Engineering: Senior and principal levels driving growth
Entry-level hiring is contracting as AI tooling reduces the leverage of junior contributors, while demand for Senior, Staff, and Principal engineers is rising. Pay bands that treat all levels the same will overpay at the bottom and underpay at the top.
AI and ML: Significant market premiums for AI-adjacent roles
AI Engineer and ML Engineer roles are among the fastest-growing and highest-compensated in Pave's dataset. Total compensation benchmarking is essential here: equity as a share of total compensation for senior AI/ML roles runs well above what base-only data suggests.
How to calculate competitive tech salary bands
Anchor to Pave's 25th, 50th, and 75th percentile data for your target geography and company size. Set a band spread of 50-80% for individual contributor roles. Apply separate structures for remote and on-site roles if your organization differentiates by location. Review alignment at least twice per year; annual reviews are not sufficient for fast-moving specializations.
Turn Market Insights Into Confident Pay Strategies
Real-time benchmarks are only valuable if your team can act on them. Pave connects market intelligence to the full compensation workflow so insights drive decisions rather than sitting in a spreadsheet, from how you structure engineering pay bands to how you run merit cycles across a distributed technology organization.
- Market Data and Market Pricing: Benchmark tech roles by level and location, then slot them into your pay structure
- Compensation Planning: Run merit cycles and promotion reviews with structured workflows, budget guardrails, and audit trails
- Team View: Surface pay gaps across engineering and product before they become retention risks
- Total Rewards and Visual Offer Letter: Show candidates the full value of their package and win offers against Big Technology companies and well-funded startups
Bring structure, speed, and confidence to your tech compensation process with Pave.
Tech Salary & Compensation Benchmarks FAQs
You have questions, we have answers. Explore some frequently asked questions about tech salary and compensation benchmarks.
Compensation data is aggregated across companies and normalized by job family, level, and geography. Traditional providers collect annually, producing data that is often six months stale. Pave uses automated HRIS, ATS, and equity management system connections to collect continuously and publish monthly.
Geographic market, experience level, company stage, and role specialization. Tier 1 markets like San Francisco, Seattle, and New York pay well above national medians. Company stage drives significant variation in equity mix. At senior levels, AI/ML, security, and infrastructure specializations command measurable premiums over generalist roles.
Yes. Equity can represent a significant share of total compensation for experienced engineers and managers at growth-stage and public companies. Base-only benchmarks understate the real cost of competitive offers. Look for benchmarks that cover base, bonus, new hire equity, and refresh grants.
Yes. Equity benchmarking requires grant-level data from equity management systems, which traditional surveys typically don't collect. Providers that source directly from the cap table and equity management platforms deliver more accurate new hire grant, refresh grant, and unvested holding benchmarks.
Compensation varies widely by role, level, geography, and company stage. Experienced software engineers, data scientists, and AI/ML specialists in major United States markets earn well above the national median, typically with equity and bonus on top of base. Entry-level roles have seen downward pressure as AI shifts demand toward senior contributors. Role-level percentile data segmented by geography and company size is the most actionable reference for compensation planning.
Look for verified, role-specific sources with regular refresh cycles. Traditional survey providers have broad coverage but a meaningful lag. Crowdsourced platforms have volume but lack normalization. Pave's Market Data provides monthly-refreshed benchmarks from automated connections across 8,700+ companies, segmented by tech job family, level, geography, company stage, and size.
Maximize the impact of every pay decision with Pave

