IT Salary Benchmarks for Employers 2026
Pave gives compensation and talent leaders real-time IT salary benchmarks by role, experience level, and specialization, with structured tools for building competitive pay bands across every IT job family.

IT Salary Trends Shaping 2026 Pay Strategies
IT compensation in 2026 is being driven by persistent talent shortages and specialization premiums that annual survey data cannot keep pace with. The BLS projects computer and information systems manager employment to grow 15% from 2024 to 2034, while demand for cloud, cybersecurity, and AI infrastructure roles continues to outpace supply. The share of companies employing at least one AI Engineer grew from 2.7% in January 2023 to 8.4% by January 2026, a role category that barely appeared in traditional salary surveys three years ago.
Demand inside IT is bifurcating by level. Pave's data shows the share of new software engineering hires rose from 19.32% to 22.77% between Q4 2023 and Q3 2025, but entry and junior-level roles fell from 19.2% to 13.9%. AI is compressing demand at the bottom while amplifying it at the top. Pave's 2026 data shows a 3.5% median salary increase across 243 companies, but for cloud architects, security engineers, and AI infrastructure specialists, that figure understates the real cost of staying competitive. Pave gives compensation teams continuously updated IT salary data and pay band management tools to price every role accurately.
Key Stats:
- +15% — Projected computer and information systems manager employment growth 2024–2034 (BLS)
- 8.4% — Share of companies employing at least one AI Engineer by January 2026, up from 2.7% in 2023 (Pave)
- 3.5% — Median salary increase in 2026 across 243 companies (Pave)Manufacturing Salary Trends Shaping 2026 Pay Strategies
Where Pave's IT Compensation Data Comes From
Pave collects compensation data through automated, persistent connections to HRIS, ATS, and equity management systems, publishing refreshed benchmarks monthly. For cloud, security, and AI infrastructure roles that can shift quarter to quarter, that recency matters.
Machine learning handles job matching across 200+ job families by level, career track, and specialization rather than job title strings. An AWS Solutions Architect and a generalist Systems Engineer at the same nominal level are benchmarked against genuinely comparable roles, not blended together.
- No stale data: Monthly updates from live system connections, not annual survey submissions
- Aggregated and de-identified: No individual companies or employees are identifiable in published benchmarks
- ML-powered job matching: IT roles benchmarked against genuinely comparable positions, not title-matched approximations
Data coverage: 8,700+ companies | Monthly benchmark refresh | 55+ countries | 200+ job families incl. IT management, cloud, cybersecurity, and infrastructure | Base, Bonus, and Equity | Integrations: Workday, Rippling, BambooHR, Gusto, Greenhouse, ADP, and 30+ more
Stop Benchmarking IT Salaries With Outdated Data
Cybersecurity talent shortages are chronic, and cloud certification premiums shift with every major platform update. Annual survey data cannot keep up. Pave's free whitepaper, A New Era in Compensation Benchmarking, explains what is driving the shift to real-time data and what it means for IT compensation teams.
- Where traditional compensation surveys fall short for specialized roles like IT
- How automated HRIS, ATS, and equity management system feeds are transforming compensation decisions
- What is holding organizations back from realizing the potential of real-time compensation data
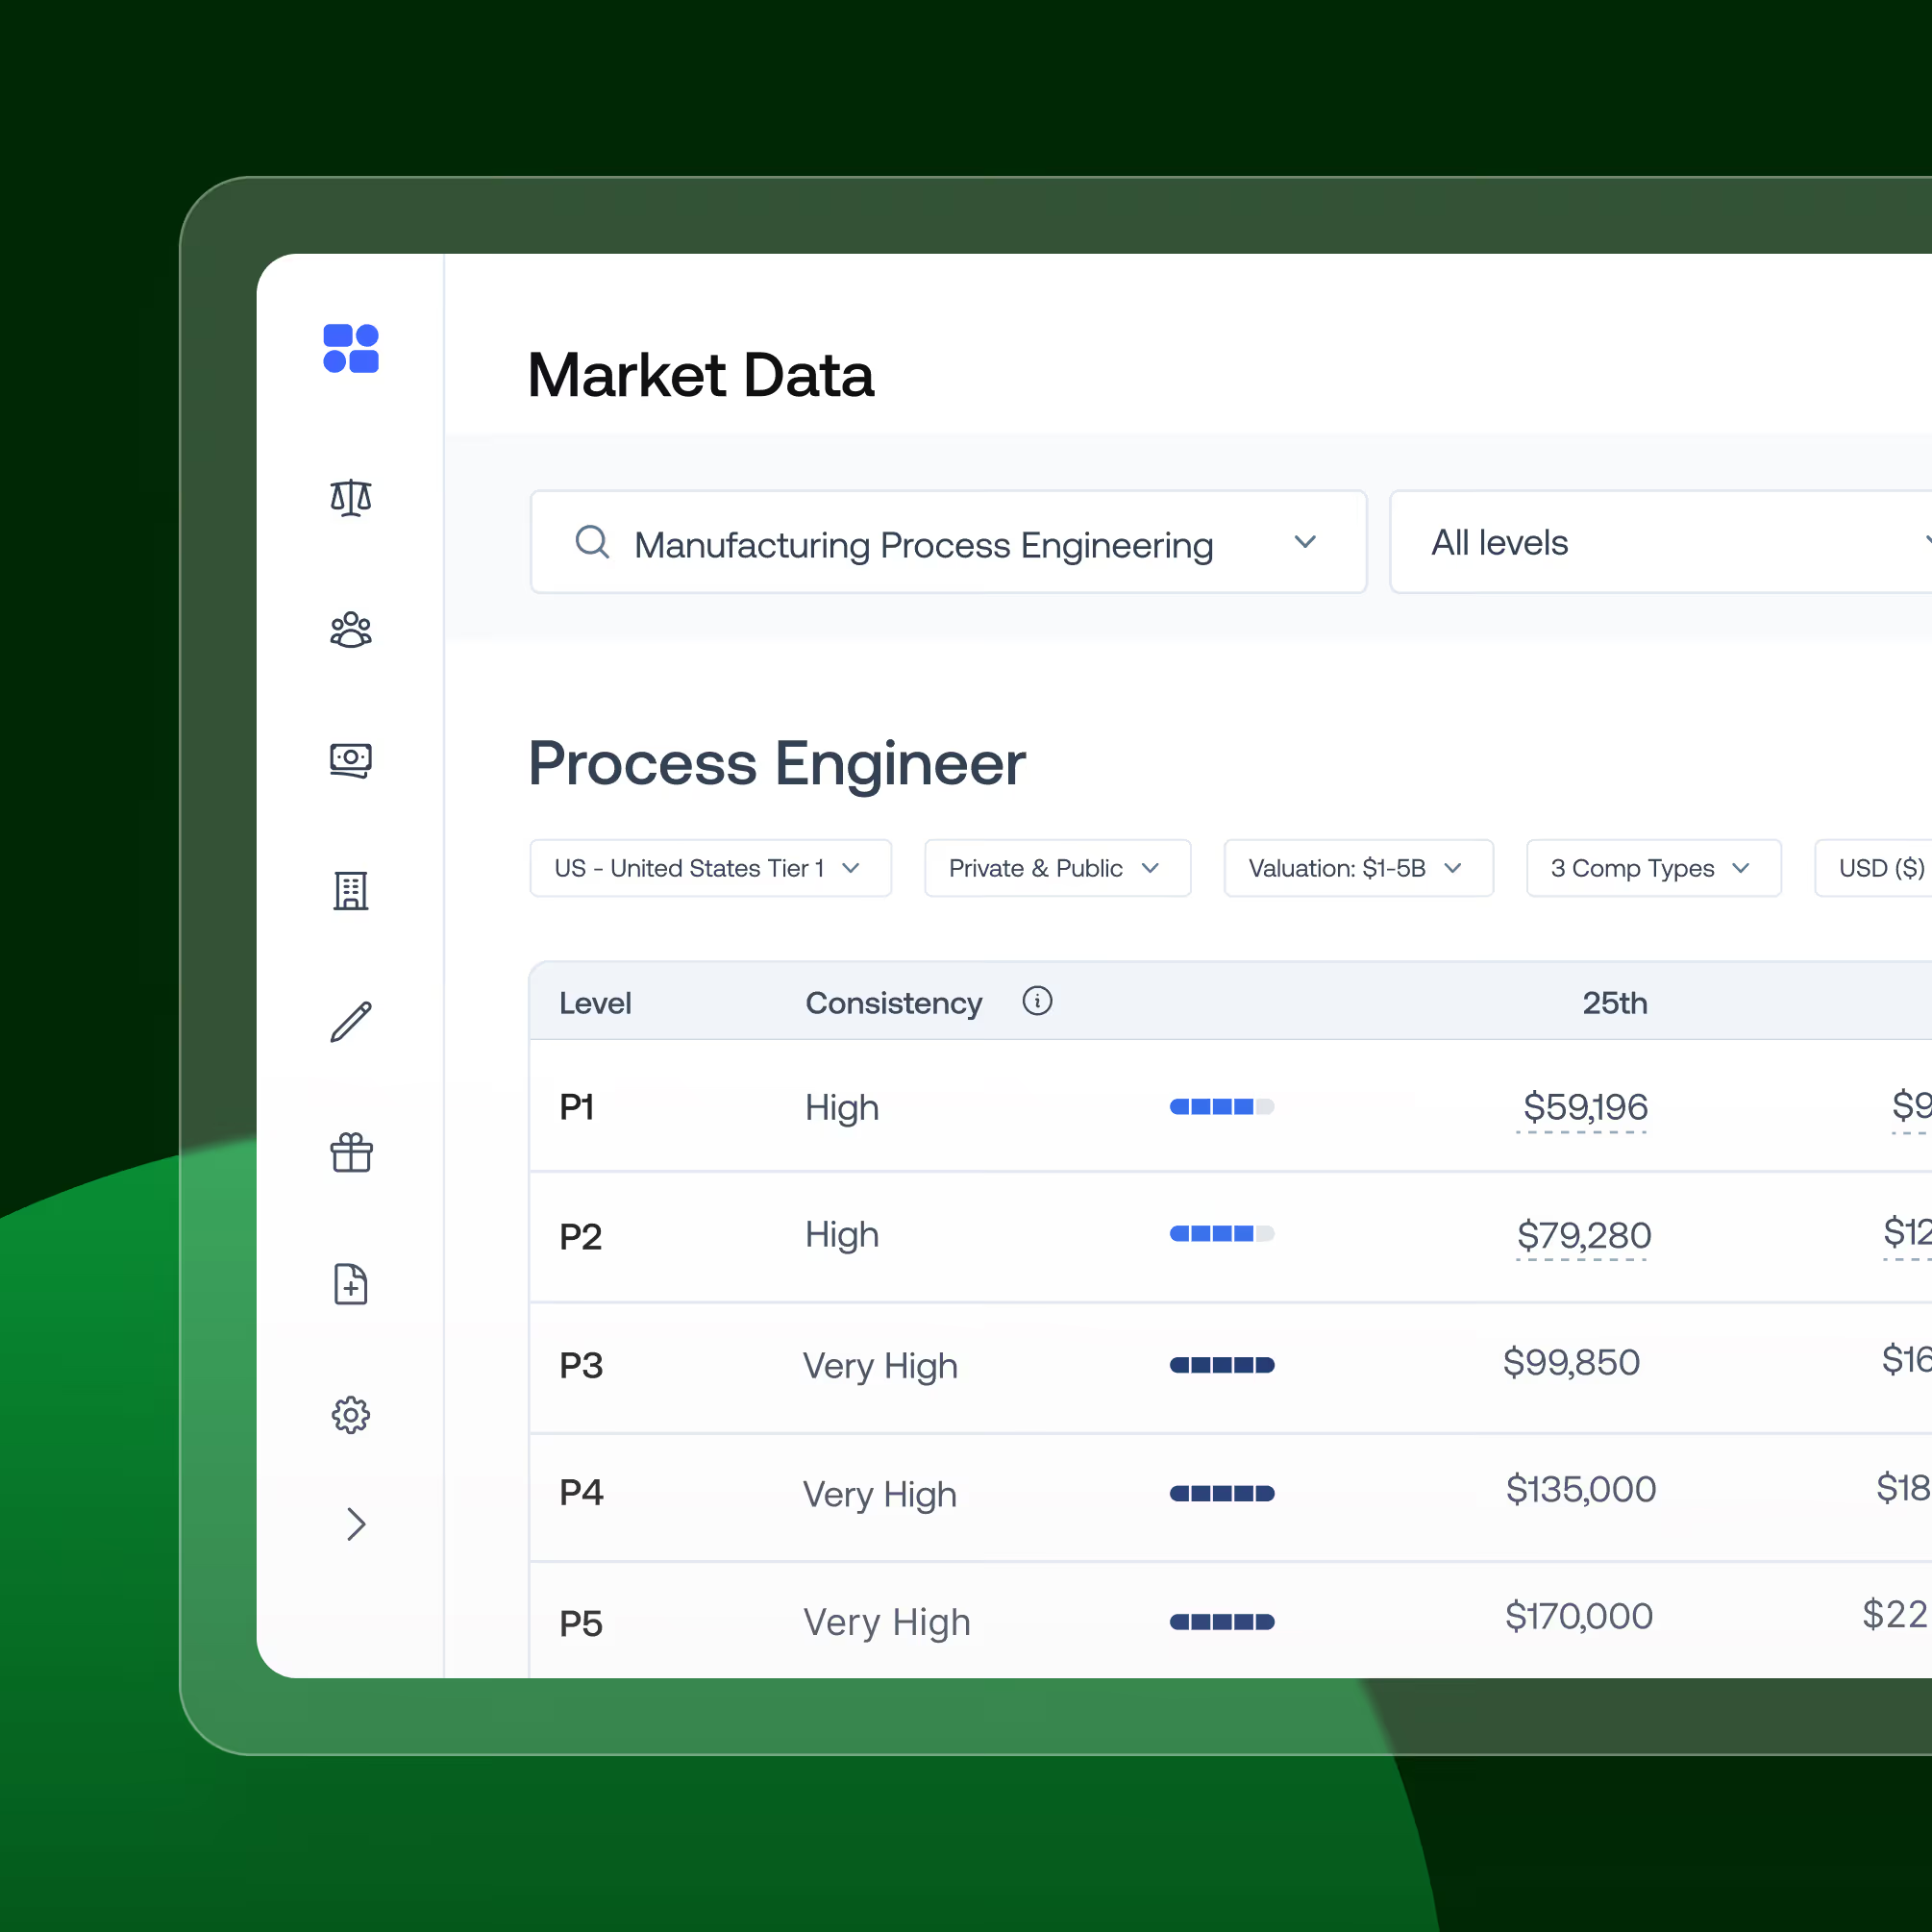
Annual IT Compensation Growth Trends
IT compensation is moving at different speeds across job families, certification levels, and remote versus on-site arrangements. A single merit percentage does not translate evenly across IT management, systems engineering, cybersecurity, and cloud infrastructure.
How to calculate competitive IT salary bands: Anchor to role-level market data at the 25th, 50th, and 75th percentiles for your target geography and company size. Apply separate band structures for high-demand certification stacks such as AWS, Azure, CISSP, and PMP. Apply separate structures for remote and on-site roles if your organization differentiates by location. Review alignment at least twice per year; cybersecurity and cloud roles can shift faster than annual cycles can accommodate.
Turn Market Insights Into Confident IT Pay Strategies
Pave connects market intelligence to the full compensation workflow, from how you structure pay bands across diverse IT job families to how you run merit cycles for a distributed IT organization.
- Market Data and Market Pricing: Benchmark IT roles by level, specialization, and location, then slot them into your pay structure
- Compensation Planning: Run merit cycles and promotion reviews with structured workflows, budget guardrails, and audit trails
- Team View: Surface pay gaps across IT teams before they become attrition risks
- Total Rewards and Visual Offer Letter: Show candidates the full value of their package and win offers for scarce IT talent
Business outcomes: Reduced IT attrition | Stronger offers for scarce talent | Pay band consistency across diverse IT job families | Defensible merit decisions | Proactive planning against persistent talent shortages
Bring structure, speed, and confidence to your IT compensation process with Pave.
IT Salary & Compensation Benchmarks FAQs
You have questions, we have answers. Explore some frequently asked questions about IT salary and compensation benchmarks.
Compensation data is aggregated across companies and normalized by job family, level, geography, and specialization. Traditional providers collect annually, producing benchmarks that are often six to twelve months stale. Better approaches use automated HRIS and ATS connections to collect continuously and publish monthly. For IT roles, specialization-level job matching matters: benchmarks that blend cloud architects with generalist systems administrators will consistently misprice high-demand roles.
Geographic market, role specialization, experience level, and company size. Tier 1 markets pay well above national medians for comparable IT roles. Cloud, AI infrastructure, and cybersecurity command measurable premiums over generalist IT at the same experience level. Company stage drives significant variation in equity mix.
Yes. Equity is meaningful at growth-stage and public companies, and on-call premiums, shift differentials, and performance bonuses are common in infrastructure and security functions. Base-only benchmarks understate the real cost of competitive offers for senior and specialized roles.
The best ones do. Equity benchmarking requires grant-level data from equity management systems, which traditional surveys typically do not collect. Providers that source directly from the cap table and equity management platforms deliver more accurate benchmarks for IT roles at equity-eligible companies.
IT manager compensation varies substantially by company size, industry, geography, and scope of responsibility, making a national median of limited use for planning. Role-level percentile data at the 25th, 50th, and 75th percentiles for your specific geography, company size, and peer group is the more actionable benchmark.
Certification stack is one of the stronger predictors of IT compensation above the generalist baseline. AWS, Azure, CISSP, and PMP each correlate with measurable salary premiums that vary by role and experience level. AI and ML infrastructure specializations have seen the fastest premium growth in recent years. Premiums compound at the senior level, where specialized expertise also carries responsibility premiums for architecture and team leadership.
Notable inflection points occur at the transition from junior to mid-level, and again at the move into senior engineering or management. Junior IT roles have seen downward pressure as AI tooling reduces entry-level leverage. Senior and principal-level roles in cloud, security, and AI infrastructure are seeing the strongest base salary growth. The move into IT management shifts total compensation meaningfully: bonus eligibility increases, equity becomes more significant, and the overall range widens relative to individual contributor roles.
Maximize the impact of every pay decision with Pave