Manufacturing Engineer Salary Benchmarks for Employers
Pave gives compensation and talent leaders real-time manufacturing engineer salary benchmarks by role, experience level, and location, with structured tools for building competitive pay bands across distributed engineering teams.

Manufacturing Salary Trends Shaping 2026 Pay Strategies
Manufacturing engineer compensation in 2026 is being shaped by growing demand and widening regional pay variation, which the annual survey data is too slow to track. The Bureau of Labor Statistics projects industrial engineer employment to grow 11% from 2024 to 2034, driven by manufacturer investment in automation and process efficiency. That demand is concentrated in specific regions and specializations, which means national average figures tell compensation teams very little about what they need to pay in a specific market.
Skills-based premiums are compounding the challenge. Engineers with automation, robotics, CNC, or lean/Six Sigma expertise command meaningfully different rates than generalist process engineers at the same level, and those premiums are moving faster than annual surveys capture. Pave's 2026 data shows companies planned a 3.5% median salary increase, but for high-demand specializations in tight regional markets, that figure understates the real cost of staying competitive. With manufacturing cost-per-hire averaging $1,046, losing an experienced engineer to a better-paying competitor is costly. Pave gives compensation teams real-time, location-specific manufacturing salary benchmarks and pay band management tools to stay ahead of the market.
Key Stats:
- 11% — Projected industrial engineer employment growth 2024–2034 (BLS)
- $1,046 — Average manufacturing cost-per-hire (Pave/Appcast)
- 3.5% — Median salary increase in 2026 across 243 companies (Pave)
Where Pave's Manufacturing Compensation Data Comes From
Pave collects compensation data through automated, persistent connections to HRIS, ATS, and equity management systems, publishing refreshed benchmarks monthly. For manufacturing organizations managing multi-site engineering teams, geographic granularity matters: a benchmark that blends national data across regions will consistently misprice roles in the markets where competition is sharpest.
Machine learning handles job matching by level, career track, and technical specialization rather than job title strings alone, whether you are pricing a Process Engineer in the Midwest or a Senior Automation Engineer on the coasts.
- No stale data: Monthly updates from live system connections, not annual survey submissions
- Aggregated and de-identified: No individual companies or employees are identifiable in published benchmarks
- ML-powered job matching: Manufacturing roles benchmarked against genuinely comparable positions, not title-matched approximations
Data coverage: 8,700+ companies | Monthly benchmark refresh | 55+ countries | 200+ job families | Base, Bonus, and Equity | Integrations: Workday, Rippling, BambooHR, Gusto, Greenhouse, ADP, and 30+ more
Stop Benchmarking Manufacturing Salaries With Outdated Data
Regional variation, skills-based premiums, and rising demand across industrial engineering are all compressing the window in which last year's data remains actionable. Pave's free whitepaper, A New Era in Compensation Benchmarking, explains what is driving the shift to real-time data and what it means for manufacturing compensation teams.
- Where traditional compensation surveys fall short, and why the lag problem is getting worse
- How automated HRIS, ATS, and equity management system feeds are transforming manufacturing compensation decisions
- What is holding organizations back from realizing the potential of real-time compensation data
Annual Manufacturing Engineer Compensation Growth Trends
Manufacturing engineer compensation varies across roles, specializations, and geographies. Base salary growth, skills premiums, and regional market competitiveness all produce different trajectories depending on where and what you are hiring for.
How to calculate competitive manufacturing engineer salary bands: Anchor to role-level market data at the 25th, 50th, and 75th percentiles for each operating location rather than blending across sites. Apply separate band structures for roles requiring specialized credentials such as CNC programming, robotics integration, lean/Six Sigma, and ERP systems experience. Review alignment at least twice per year; manufacturing labor markets in high-growth regions can shift faster than annual review cycles can accommodate.
Turn Market Insights Into Confident Manufacturing Pay Strategies
Pave connects market intelligence to the full compensation workflow, from how you structure pay bands across multiple plant locations to how you run merit cycles for distributed engineering teams.
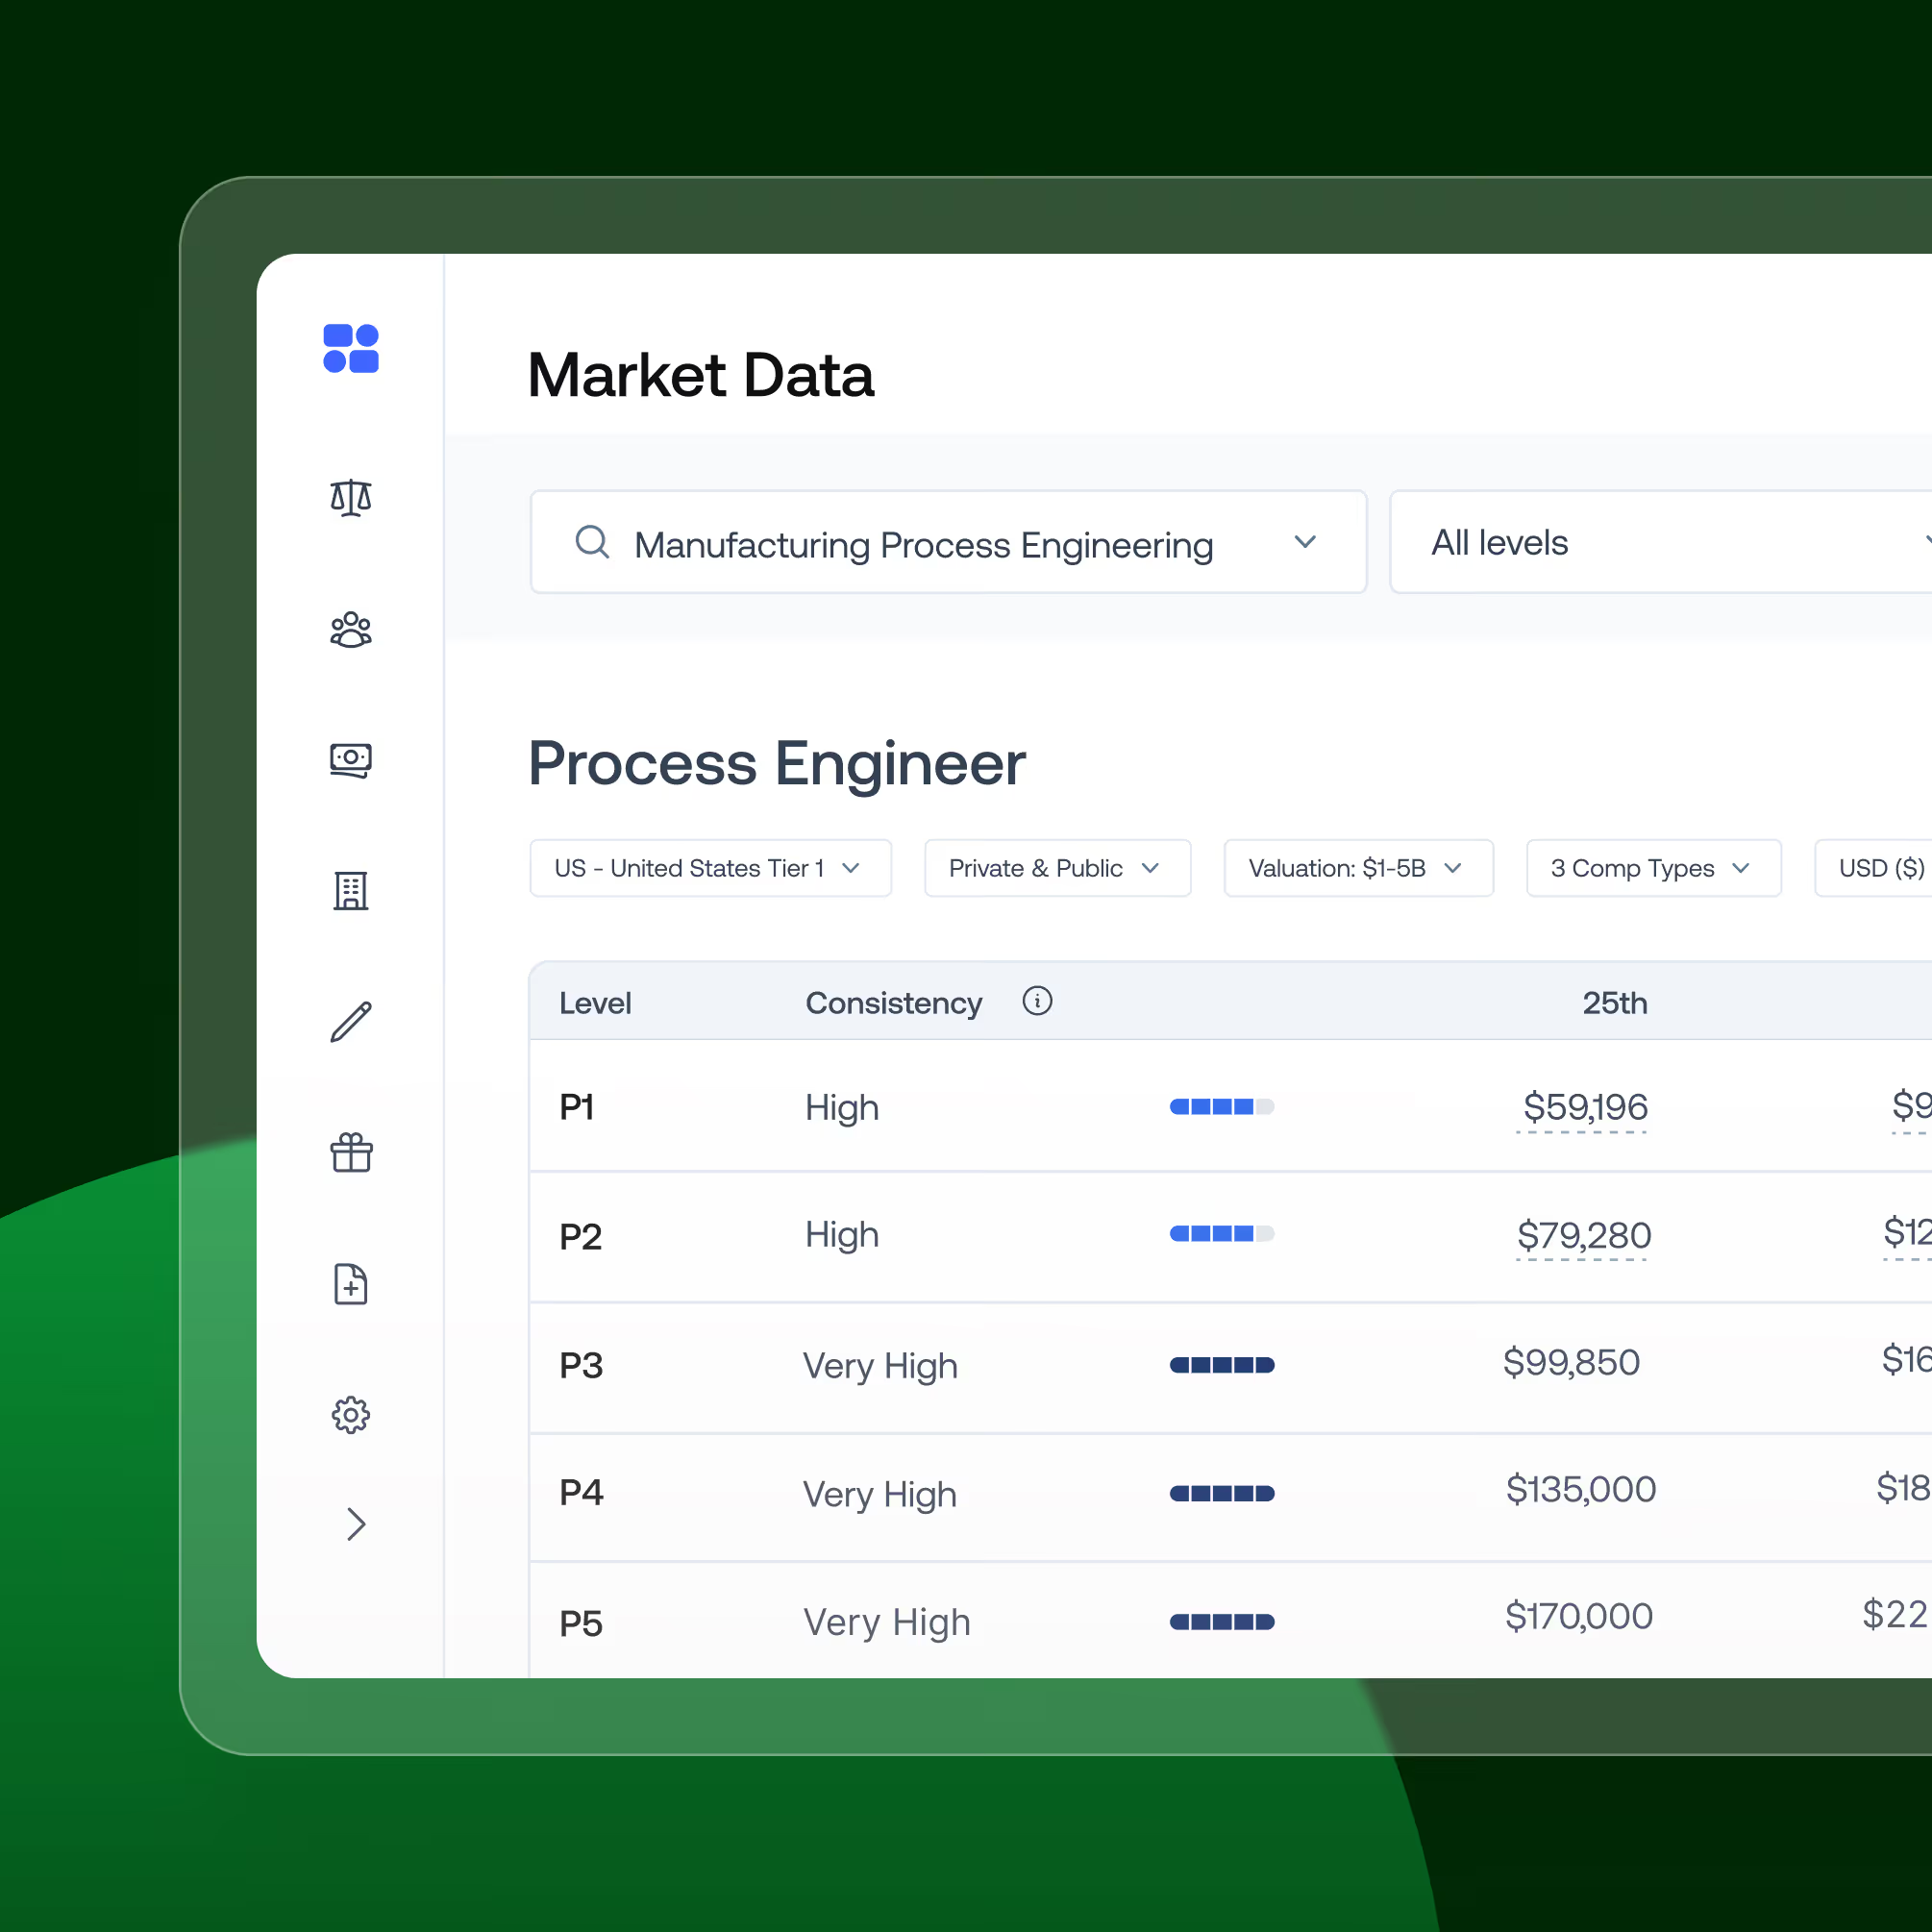
- Market Data and Market Pricing: Benchmark manufacturing engineer roles by level, specialization, and location, then slot them into your pay structure
- Compensation Planning: Run merit cycles and promotion reviews with structured workflows, budget guardrails, and audit trails
- Team View: Surface pay gaps across engineering teams before they become attrition risks in tight regional markets
- Total Rewards and Visual Offer Letter: Show candidates the full value of their package and win offers against competitors paying closer to market
Business outcomes:
Reduced attrition of experienced manufacturing talent | More competitive offers in tight regional markets | Pay band consistency across multi-site operations | Defensible merit decisions | Proactive planning against projected industry growth
Bring structure, speed, and confidence to your manufacturing compensation process with Pave.
Manufacturing Engineer Salary & Compensation Benchmarks FAQs
You have questions, we have answers. Explore some frequently asked questions about manufacturing engineer salary and compensation benchmarks.
Compensation data is aggregated across companies and normalized by job family, level, geography, and specialization. Traditional providers collect annually, producing benchmarks that are often six to twelve months stale. Better approaches use automated HRIS and ATS connections to collect continuously and publish monthly. For manufacturing roles, accurate location filtering and specialization-level job matching are critical: blending automation engineers with generalist process engineers, or averaging across regions with different labor costs, will consistently misprice roles.
Geographic market, technical specialization, experience level, and industry segment. Regional variation is pronounced in manufacturing: automotive-heavy Midwest markets, aerospace corridors, and semiconductor regions each reflect distinct supply and demand dynamics. Automation, robotics, and CNC expertise command higher rates than generalist process engineering at the same career level. Aerospace, defense, and semiconductor manufacturing typically pay above broader industrial averages.
Yes. Shift differentials, performance bonuses, and profit-sharing are common in manufacturing and can represent a meaningful share of total annual compensation. For senior engineering and management roles, equity may also be part of the package. Base-only benchmarks understate the real cost of competitive offers, particularly when competing for experienced talent.
The best ones do. Profit-sharing and performance bonuses are standard at many manufacturing organizations, and equity is increasingly common for senior roles at public or venture-backed manufacturers. Providers that collect total compensation data through direct system connections rather than manual survey submissions produce more accurate and complete benchmarks.
It varies substantially by experience, specialization, and geography, making a single national average of limited use for compensation planning. Engineers with automation, robotics, or lean/Six Sigma specialization command significantly higher rates than generalist peers. Geographic market adds further variation: manufacturing salaries in major industrial corridors and coastal markets run above national averages. Role-level percentile data at the 25th, 50th, and 75th percentiles for your specific location and peer group is the more actionable benchmark.
The steepest progression typically occurs between entry level and the first senior engineering role. Specialization in automation, robotics, CNC, or ERP systems consistently commands premiums above generalist peers at the same level. Lean/Six Sigma certification and advanced degrees in industrial or mechanical engineering support movement into engineering management. The highest total compensation typically reflects senior or principal-level experience, a high-demand specialization, and direct responsibility for production efficiency or capital projects.
Maximize the impact of every pay decision with Pave

