When asked about workplace safety, most manufacturing executives mention EHS teams, training, machine guarding, or OSHA audits. Few consider the compensation plan.
New research says they should.
A study of more than 41,000 establishment-year OSHA injury records, spanning 629 U.S. companies over a decade, found that granting stock options to rank-and-file employees causally reduces work-related injury rates. Not executive options—options for the people actually running the line.
The effect was substantial: a one-interquartile-range increase in broad-based employee options was associated with a 7.44% reduction in injury rates. For perspective, the researchers note that it's a larger effect than existing estimates for penalty-imposing OSHA inspections or plant unionization.
Previous discussions have highlighted that turnover increases safety risks, that new employees pose the highest recall risk, and that compensation and safety strategies are closely linked. This research provides causal, peer-reviewed evidence supporting this view and identifies a specific compensation tool rarely used for frontline employees.
What The Research Means For Manufacturing Leaders
Researchers from City University of Hong Kong, Melbourne Business School, and T A Pai Management Institute matched OSHA’s establishment-level injury data with compensation records to determine if rank-and-file stock options predict injury rates. They controlled for establishment size, hours, strikes, shutdowns, leverage, firm size, and executive option pay. The negative relationship remained consistent across all measures and samples.
The industries with the most at stake will look familiar. In the study's data, transportation had the highest injury rate at roughly 10.6 injuries per 100 employees per year, with food products (8.6) and automobiles and trucks (8.1) close behind—all well above the sample average of 6.6.
The study established causation through a 2005 accounting rule change, FAS 123R, which required companies to expense stock options at fair value. As a result, option grants to rank-and-file employees declined sharply, creating a natural experiment. If broad-based options protect workers, injury rates should have increased most at companies that reduced options the most, as the data showed. Before the rule change, injury trends were statistically identical between affected and unaffected firms. Afterward, injury rates rose significantly at firms that made the largest cuts and continued to increase for years.
A change in the compensation plan led to a change in injury rates. This demonstrates causation and highlights compensation as a tool for safety improvement.
How Stock Options Drive Safety: Retention and Teamwork
Employees do not work more carefully simply because of a vesting schedule. The mechanisms are structural and address challenges already familiar to manufacturing HR leaders.
Retention: Unvested equity provides experienced workers with a tangible reason to stay, and their experience contributes to safety. New employees face the highest injury risk; research shows injury rates decline as tenure increases and workers learn a plant’s specific hazards and protocols. The safety effect of broad-based options was strongest at companies with high labor mobility, where experienced employees often leave for competitors. If this reflects your labor market, the impact of this approach is greatest.
Cooperation: Options serve as a group incentive, linking grant value to collective performance. This changes workplace dynamics; prior research shows employees with equity stakes engage in more peer training and are more likely to address unsafe behavior. The safety effect was strongest where free-riding is more likely, such as in locations far from headquarters. For manufacturers with multiple plants, group incentives help promote accountability across the workforce.
The Business Case for Safer Factories
If safety considerations do not influence capital allocation decisions, valuation may. The same study found that higher injury rates predicted lower Tobin’s Q and lower stock returns the following year. Prior research estimates the expected firm-value cost of a single additional workplace injury at approximately $270,000, excluding OSHA penalties, workers’ compensation premiums, line downtime, and reputational costs.
This argument parallels the one made in the food safety discussion regarding recall economics. Compensation design should be viewed as operational risk management, not merely administrative overhead.
How to Structure Frontline Stock Option Programs
At this point, research requires practical application, as the mechanism depends on unvested value. Employees with no remaining unvested equity lack a structural reason to stay through the next hiring cycle. Therefore, vesting structure, rather than grant size alone, is critical. Pave’s The New Age of Equity: 2026 Equity Program Trends, based on millions of equity grants, provides the current blueprint that manufacturers can leverage to build out a frontline workforce equity program:
- Four-year linear vesting remains the standard for private companies and has become more prevalent over time. In 2025, 85% of private-company new-hire grants had four-year durations.
- Vesting cliffs are primarily used for new hires, not tenured employees. In 2025, 80.1% of private-company new-hire grants included a vesting cliff, up from 77.1% in 2020, while cliff usage on ongoing grants declined from 34.6% to 17.6%.
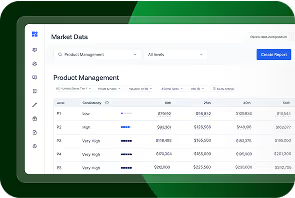
- The refresh gap is a common point of failure in most programs. Pave benchmarks show that only about 25% of P1-level employees receive ongoing refresh grants, compared with 83% of P6-level employees. According to the research, ending frontline programs after the initial grant undermines retention just as employees become most valuable for safety.
Effective execution requires three elements. First, access to real-time equity benchmarks at the frontline level and across locations ensures your design reflects current practices. Second, consistent refresh decisions across managers are essential; tools like Pave’s Compensation Planning integrate guidelines into workflows, highlight vesting-cliff risks, and allow managers to make final decisions. Third, employees must understand their equity; Pave’s Total Rewards Portal lets them view their full package and explore the potential value of their equity, since understanding is key to retention.
Takeaways for Manufacturing Safety and Compensation
- Compensation plans, especially frontline stock options, can be a powerful tool for reducing workplace injuries.
- Retention and teamwork are the main drivers—experienced, invested employees make factories safer.
- Design stock option programs with ongoing vesting and regular refreshes to maximize both safety and retention.
- Use real-time equity benchmarks and clear communication to ensure employees understand and value their equity.
- Regularly review your compensation plan to ensure it supports both safety and financial goals.
Manufacturing leaders have long sought scalable safety interventions. Evidence now shows that compensation plans can be an effective tool. The mechanisms—retention and cooperation—are already within your control, and the design strategies are well documented. The key question is whether your current compensation plan is structured to achieve these outcomes.
Curious how manufacturers at your stage structure frontline equity? Benchmark your program against real-time market data

Charles is a member of Pave's marketing team, bringing nearly 20 years of experience in HR strategy and technology. Prior to Pave, he advised CHROs and other HR leaders at CEB (now Gartner's HR Practice), supported benefits research initiatives at Scoop Technologies, and, most recently, led SoFi's employee benefits business, SoFi at Work. A passionate advocate for talent innovation, Charles is known for championing data-driven HR solutions.