The equity benchmarks we have been using to guide candidate and employee equity are flawed: they are missing key details about the equity practices that provide meaning to equity grants.
There are three primary issues with equity benchmarking:
- They lack information about equity practices
- They lack context on the type of equity/grant
- They lack standardization around how the equity value is calculated & understood
We dive deep into these issues and how to solve them in our most recent guide “(Most) Equity Benchmarks Are Lying to You,” and cover them at a high-level below.
Information about equity practices
The structure of equity grants – equity vehicle, vesting duration, vesting interval, vesting structure – influences the value of that grant. And yet, equity benchmarks never include these details.
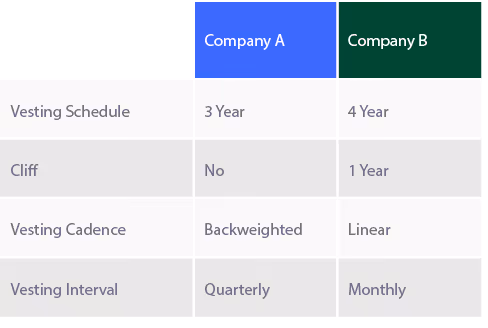
Let’s compare two employees at two companies that would fall into the same “benchmark” in most equity benchmarks. They both have these basic benchmarking stats:
- Company Valuations: $1.5B
- Intended Grant Value: $100,000
- Number of Shares: 11,310
- % Ownership: 0.005%
- Equity Type: RSUs
- Vesting Start Date: Jan 2020
However, they differ in their equity practices:
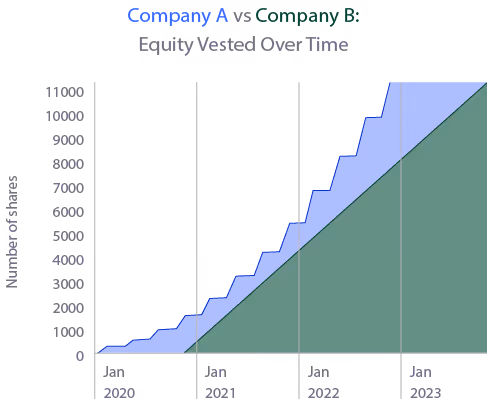
At 2.5 years (the average startup employee tenure), these employees would have vested drastically different amounts:
- Compay A Employee: 7,975 shares
- Company B Employee: 5,655 shares
This means that at 2.5 years, the employee at Company B has vested 41% more than the employee at Company A – but the equity benchmark would call these two employee’s equity compensation functionally the same!
Context on the type of equity/grant
There are half a dozen common reasons employees receive equity:
- at hire
- at promotion
- for performance
- at a certain tenure interval
The amount of equity varies wildly depending on the reason, and yet most equity benchmarking providers offer “Total Equity” value.
A rare few will distinguish between “new hire grant” and “refresh grant”, and virtually no benchmarking providers offer equity benchmarks for the different reasons why employees are granted equity, or benchmarks into the most common practices used by companies to calculate these different types of equity.
They lack standardization about the value of equity
When you pull an equity benchmark in dollar-terms, are you looking at the value at time of grant, at time of vest, or today? Is it the gross equity, value or percent ownership? Is it over the vesting lifetime, or for 1 year of vesting?
Grant values differ wildly across time depending on a company’s performance and the macroeconomic environment; there is no “atomic unit” by which to measure equity value to an employee it is impossible to compare equity packages. That means that when you look at equity benchmarks, you are never comparing apples to apples.
By omitting equity practices and aggregating equity types, equity benchmarking providers aren’t sharing the full truth about equity benchmarks. These omissions can lead to dramatically different equity outcomes and benchmarks.
If you're interested in learning more about how equity benchmarks are lying to you, or what you can do about it (both in the short term and the long term), check out our guide “(Most) Equity Benchmarks Are Lying to You” where we go deeper into these problems, and share a glimpse into the most common equity practices behind equity benchmarks.

Katie is an operations leader at Pave. Prior to joining Pave, Katie held various roles at Segment.


.avif)