Pave VCECS 2025
Pave’s VCECS highlights Executive compensation benchmarks for VPs, SVPs, and C-level positions at private companies.
Learn more and request your copy below.

About the VCECS
Historically, the Venture Capital Executive Compensation Survey (VCECS) has served as the central hub for partners and participating companies to access compensation benchmarks through a single Excel file. Since Pave's acquisition of Option Impact years ago, we have worked to integrate this experience directly into the Pave platform.
We encourage you to use the Pave Market Data product as your primary source for the most up-to-date compensation data, as it provides real-time information along with expanded coverage of roles, regions, and enhanced filtering capabilities. This report represents a snapshot of data pulled from the platform in November 2025.
The VCECS only includes data from private companies, as to better align with the intended audience of this report.
Disclaimer: This report was produced through the Pave system. Information contained in this report may not be distributed, either in part or in whole, to any company or person not involved with Pave's VC partners, consulting partners, or participating companies. Data contained in this report is subject to copyright and may not be distributed to unauthorized users without written consent from Pave.
Interested in the VCECS?
The global VCECS is available to Pave partners. Partners on our Pro package also have access to a supplemental VCECS, which includes US Tier 1, Tier 2, and Tier 3 data.
For more Information on how to access this report or become a partner, complete the form and we will reach out to you via email.
Get your copy of the Global VCECS
Pave Methodology
In March 2021, Pave launched an innovative approach to compensation benchmarking using data collected directly from automated and persistent (i.e., real-time) connections to human resources (HR) platforms, including human resources information systems (HRIS), applicant tracking systems (ATS), and equity management systems (EMS).
Our real-time model, coupled with the use of sophisticated data science techniques and machine learning algorithms, provides customers with improved compensation benchmarks and a radically streamlined user experience.
Today, more than 8,300 companies—including more than 1,000 medium and large enterprises—use Pave’s Market Data product as their primary or secondary compensation data source and enjoy significant advantages over companies that rely solely on traditional compensation surveys. For more information, visit our Market Data Methodology page.
What you'll find inside
Australia
Canada
Germany
Israel
United Kingdom
United States
Accounting (Generalist)
AI & ML Engineering (Blend)
Analytics (Blend)
Brand Management
Business Development
Business Operations (Blend)
Business Unit Head
Chief Accounting Officer
Chief Customer Officer
Chief Executive Officer
Chief Financial Officer
Chief Information Security Officer
Chief Information Systems Officer
Chief Legal Officer
Chief Marketing Officer
Chief Operations Officer
Chief People Officer
Chief Product Officer
Chief Revenue Officer
Chief Technology Officer
Corporate / General Legal
Corporate Development
Customer Service
Customer Success
Data Science
Finance (Generalist)
Financial Planning & Strategy (Blend)
Hardware Engineering (Blend)
HR Services (Blend)
Information Security (Blend)
Information Systems (Generalist)
IT Infrastructure & Operations (Blend)
Market Research
Marketing (Generalist)
Marketing Ops & Strategy (Blend)
Partnerships
Product Design
Product Management
Product Marketing
Professional Services Consulting (Generalist)
Revenue Operations
Sales Management
Software Engineering (Blend)
Talent Management (Blend)
Tax
Total Rewards
Treasury, Risk & Compliance (Blend)
Base salary
Target total cash
Total equity
Target variable pay ($)
New hire equity
Target variable pay (%)
Ongoing equity
Company stage
Equity valuation
Industry
Grant timeframe
Founder status
Grant value
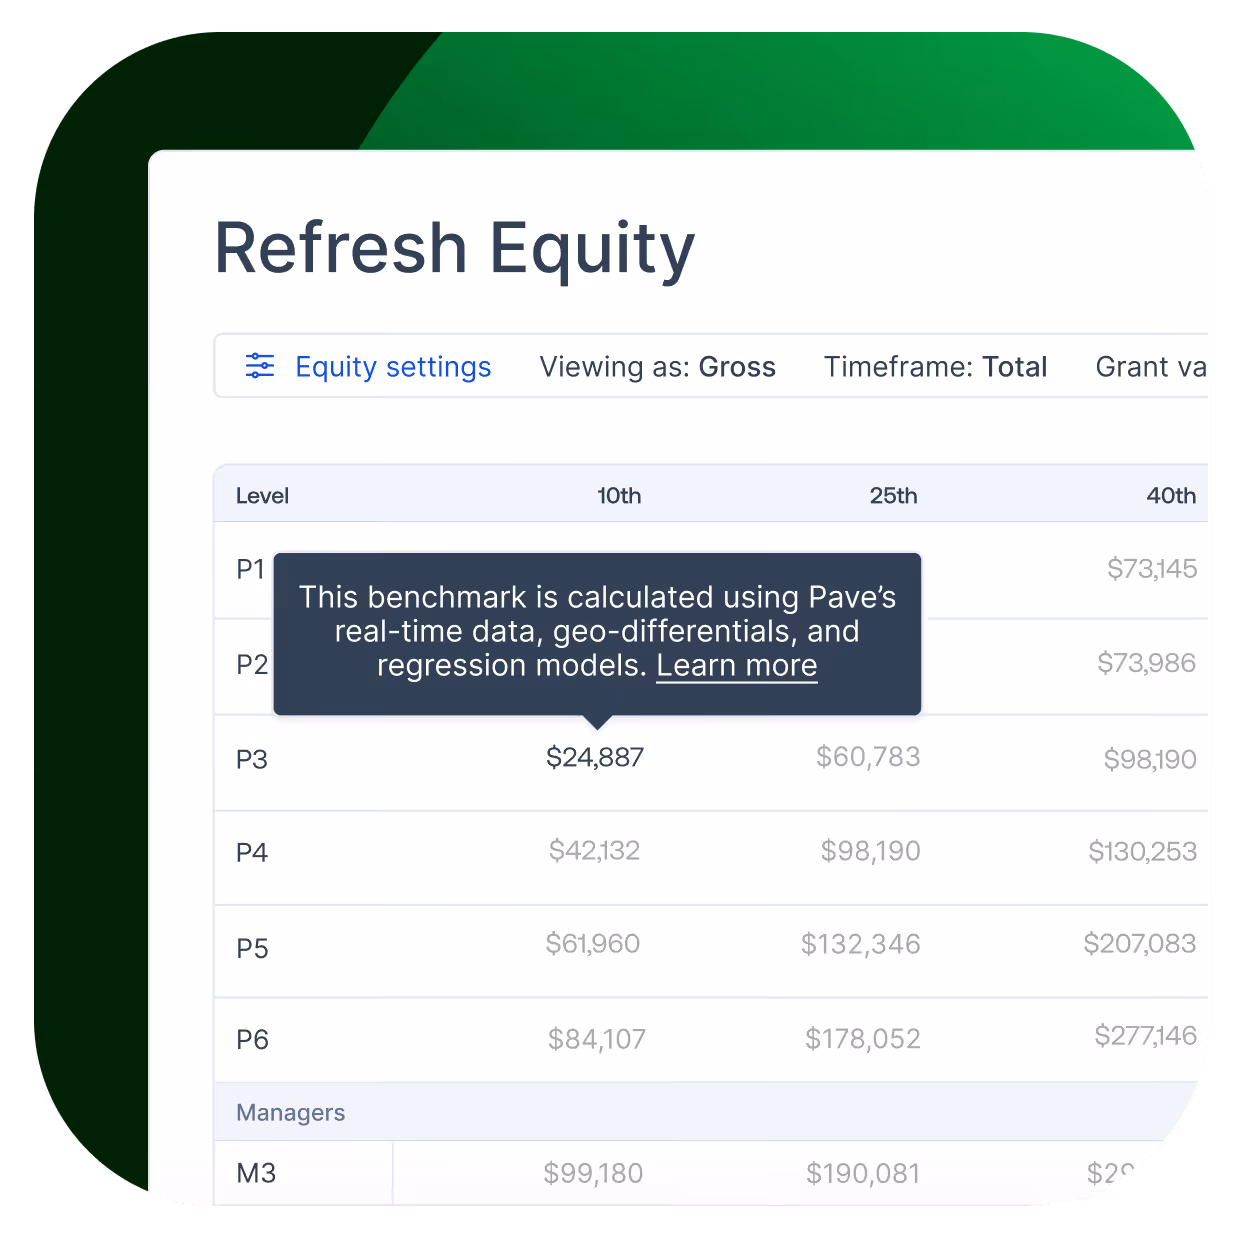
Calculated Benchmarks
If a sample size is 0 but data populates, we've used Calculated Benchmarks. Pave’s Calculated Benchmarks feature uses machine learning (ML) to identify patterns across the dataset that can be used to provide more relevant, accurate, and timely benchmarks. Using these patterns, we then apply a series of regression models to generate reliable results in places where robust data is often lacking (e.g., job families with low incumbent counts or markets with smaller concentrations of talent).
Our algorithm is tested extensively against real market data and by industry experts at compensation consulting firms to validate outputs. In many ways, our approach emulates the manual data “smoothing” (or normalization) process already used by most compensation professionals.
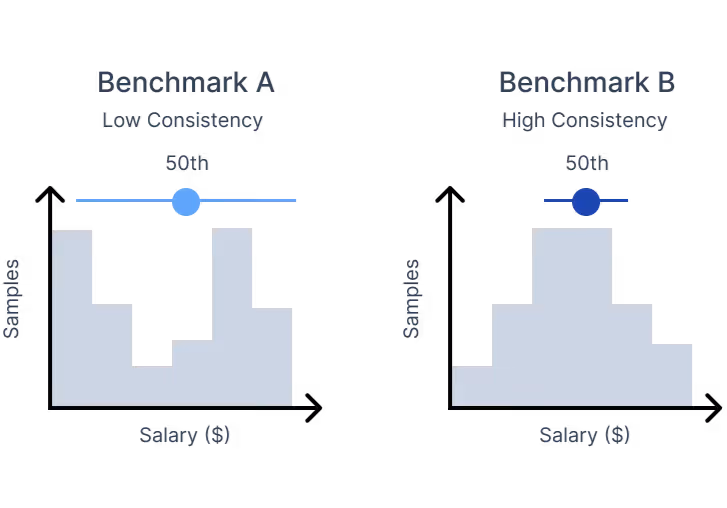
Consistency Labels
The Consistency Scale provides insight into the variability of the data within each benchmark to provide context on how reliably it represents the market. Consistency labels reference the confidence interval of each benchmark to inform its consistency.
For example, A and B (left) have the same value for the 50th percentile and the same number of samples. However, you can see that Benchmark A clusters below the 50th percentile and right above the 50th percentile, indicating there is limited consistency in how the market is compensating this role. Benchmark A would be labeled as Limited Consistency.
In Benchmark B, the data follows a normal distribution and is clustered around the 50th percentile, indicating there is consistency in how the market is compensating this role. Benchmark B would be labeled as High Consistency.
Insights from Pave Data Lab
Pave Data Lab is our AI-powered insights community for all partners, as well as compensation and total rewards professionals. Pave Data Lab gives you access to daily interactive analyses from our data science team, plus invites to join weekly quick polls and regular pulse surveys. Explore previews of some of our executive-related insights.

Variable pay targets as percentage of base for executives

Executive turnover rates by title

Total team size benchmarks by manager level

Geo-discounts by track across countries

PE-backed company pay differentials
What's new in executive compensation?
Pave's articles bring you the latest thought leadership and trends from expert voices within Pave and at our partner firms. Dive in to our articles, case studies, guides, and events to understand today's most salient trends in compensation.

Is Your Org Structure Top-Heavy?
Pave Data Lab Roundup
What the heck is a "Head of"?
Pave Data Lab Roundup
Private vs. Public Company Equity
Partner Contribution
The future of compensation management is here

