Pave’s acquisition of Option Impact from Morgan Stanley increases our customer count to 5,700. This makes Pave the largest compensation provider for private companies in the world. Learn more here about the acquisition and new round of funding led by Index Ventures.
What is the most expensive item you have ever purchased? A house? A car? An investment portfolio?
If you are like me, you probably spent weeks (months?) scanning Zillow, Carvana, or Yahoo Finance to watch the real-time pricing fluctuations before making your purchase. These marketplaces may be painful–the current market downturn certainly isn’t fun. But, they are fair. Buyers and sellers have full access and control to the information needed to make their decisions.
What about the macroeconomy – what is the most costly item on Earth? Healthcare? Education? Military spending? Nope.
Roughly half of every single dollar produced in the world’s GDP goes towards employee wages. That’s correct–half of GDP is compensation!
Compensation is, simply put, the most expensive thing in the world.
Yet, compensation is the last major global marketplace without a real-time price.
“Compensation fairness” is a guessing game built on blind trust. Think about the last time you had to ask for a raise or negotiate a job offer. We have all been there. These conversations are highly uncertain, emotional, and extremely unfair due to the lack of universally available information to effectively inform decisions on both sides of the employer-employee relationship.
At Pave, we are building the record of truth for every compensation profile in the world.
Eventually, we will make this compensation graph universally accessible so that all 4 billion members of the global workforce can freely earn what they deserve.
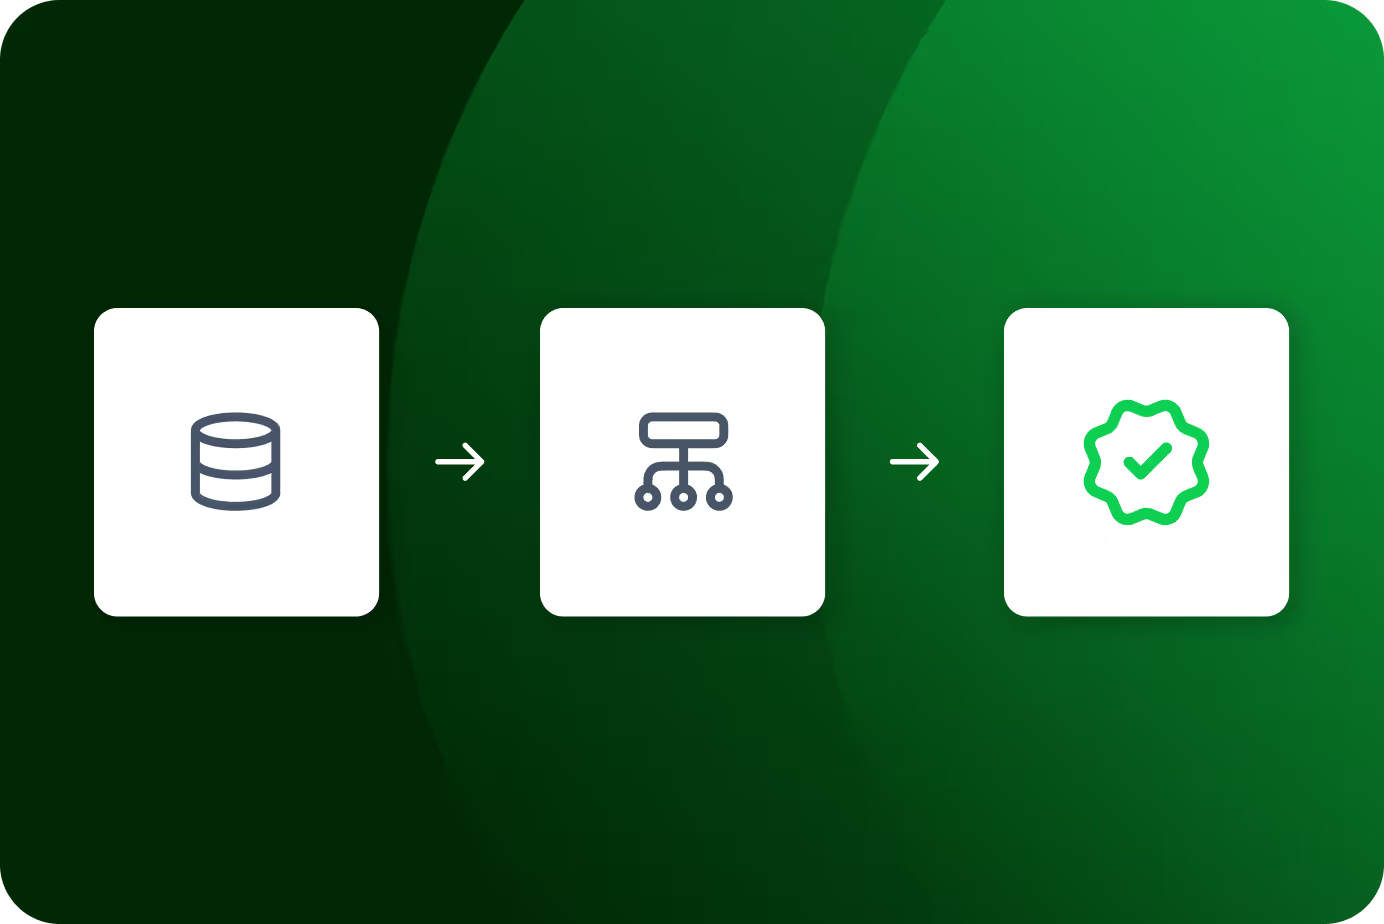
Here’s the plan:
- Build tools to get real-time compensation data from tech companies
- Make the aggregated compensation data available to accelerate our acquisition of even more data
- Seamlessly integrate the tools with the data to build the most intelligent compensation platform
- Construct a universally accessible compensation graph from the data
- Repeat steps 1–4 for all industries
Today, we are relentlessly focused on steps 1 and 2 and just starting to think about step 3.
Step 1 – Build tools to securely get real-time compensation data from tech companies
In April of 2020, we went through an intense interview to get Pave into Y Combinator. Covid had just started, so it was over Zoom. And I had failed a previous YC interview in 2019, so I was sweating bullets.
I came prepared with TAM analyses, product screenshots, and competitor breakdowns. But none of that mattered. For 15 minutes, I was drilled by the YC investment partners on one single question from 93 different angles:
“Why the &$(# did your early customers give you API-access to their HR data? This doesn’t add up.”
When the Zoom call abruptly ended, I found myself staring at a blank screen. I texted an early advisor: “Uhh I think I bombed that; they didn’t even ask about the business.”
Looking back, it makes more sense now. At the time, we had signed three early customers who had each integrated their respective Greenhouse, BambooHR, and Carta instances. This meant that by having signed 3 early customers, we had real-time access to salary, bonus, equity, and benefits information from over 1,500 employees.
Common wisdom would suggest that companies would not want to risk sharing their HR data with a 3rd party. Something didn’t add up to the YC partners. What is Matt hiding from us…?
But we had discovered the early signs of a contrarian thesis that would surprise most experts. If you build compensation workflow tools that address the most visceral compensation pain points, tech companies will actually integrate their HR systems.
Today, we have over 2,700 integrated customers. The early thesis was right.
The two tools that kickstarted our initial collection of compensation data were:
- A compensation dashboard for candidates and employees called “Communicate”
- A merit cycle tool for managers and executives called “Plan”
Step 2 – Make the aggregated compensation data available to companies to accelerate our acquisition of even more real-time data
Historically, it has been extremely difficult for tech companies to get the market data needed to confidently compensate employees. The primary datasets that customers have used are powered by manual upload processes which are error prone and ~6-12 months behind the market.
In December of 2020, we had around 25 customers. Just enough to bootstrap “step 2” of the plan, right?
Alongside our Series A fundraise, we confidently announced the plans for our “Real-time Benchmarking” product to the world.
Our premise was a bold “give-to-get” vision sell to the market:

At the end of Q1 2021, we released the v1 of our Benchmarking product with data from ~400 integrated companies. We thought 400 companies would be enough to solve the proverbial chicken-or-egg problem. Right?
We were very wrong. The initial customer feedback for Benchmarking was atrocious. V1 of our Benchmarking product had a negative 40 NPS.
Was there a silver bullet to fixing the product? Well, yes. But it was an extremely difficult one to solve…get a lot more customer integrations (hundreds? thousands?) to fill in the data coverage holes. Keep pushing the boulder uphill as fast as possible and maybe, just maybe, we would find the mountain’s crest and see the boulder start to fall down the other side.
It worked. We now have 2,700 customers integrated in our Benchmarking product. Benchmarking is no longer a weakness. The product is loved by thousands of users and acts as a major accelerating force in our pursuit to acquire even more compensation data.
Today, we have even more good news to share. The acquisition of Option Impact from Morgan Stanley (as well as Option Driver and VCECS) is a piecewise step forward in the aggression behind our accelerating data acquisition goals. Option Impact and Pave combined now account for over 5,700 customers in one compensation database.
Step 3 – Seamlessly integrate the tools with the data to build the most intelligent compensation platform
We are just starting to get serious about step 3 of the plan.
Every compensation decision that an employer makes should be based on real-time market data. That is why we plan to tightly integrate our workflow tools with our market data to build the first ever live compensation platform the industry has ever seen.
More data = better insights = more valuable tools = more customers = more data. It’s a positive feedback cycle.
Step 4 – Construct a universally accessible compensation graph from the data
Today, we have a one-sided graph. Employers join the Pave ecosystem as customers, integrate their systems, and get access to our tools and data in return.
The true power of Pave will be when we eventually unlock universal access to this compensation graph.
Every single member of the global workforce should have access to the information needed to answer a very basic question:
Am I being paid fairly?
Step 5 – Repeat Steps 1–4 for all industries
Compensation is part of a very small shortlist of experiences on Earth that are universal for every single employer in the world as well as all 4 billion members of the global workforce.
Every single company–software companies in Sunnyvale, manufacturing companies in Mauritius, restaurants in Rabat–needs to figure out the optimal wage rate to pay its employees and how to stay calibrated with the market.
Over the past two years, we have been humored by inbounds demo requests from companies including Domino’s Pizza, PWC’s Middle East Branch, and Deloitte. They’re not our focus today, but we are comforted (or bothered!) knowing that compensation pain points transcend all geographic and industry borders.
Summary
The key behind everything?
Real-time access to HR data so that we can make the world’s compensation graph universally accessible and useful.
In short,
- Build tools to get data
- Use the data to get more data
- Integrate the tools with the data
- Construct a compensation graph from the data
- Repeat the above for all industries
.avif)
Matt Schulman is CEO and founder of Pave, the complete platform for Total Rewards professionals. Prior to Pave, he was a software engineer at Facebook focusing on user-centric mobile experiences. A self-proclaimed "comp nerd," Matt is known for sharing data-driven thought leadership around all things compensation and personal finance.