
Key Takeaways
- Pave's own data across 1,856 companies shows a median IT staffing ratio of about 1 IT team member per 75 employees, though it varies widely by company size and industry.
- IT staffing ratios generally loosen as companies scale, per third-party benchmarks, since standardized tools and processes let one IT team member support more people.
- Highly regulated industries like financial services and healthcare run much tighter ratios (roughly 1:50-100) than manufacturing, retail, or education, which often run 1:200 or leaner-staffed still.
- AI-powered support tools are already changing headcount patterns in adjacent support functions, and IT is likely to see similar pressure on Tier-1 ticket volume.
- There's no single healthy ratio. The right number depends on your company's size, industry, and how much of Tier-1 support is already automated.
How big should your information technology (IT) team be? I was recently asked this question by the CEO of a pre-IPO tech company who was worried that his company’s IT department was bloated.
Here's what the benchmarks say.
{{mid-cta}}
IT Team Size Benchmarks
We analyzed Pave data from 1,856 companies with 100+ employees and at least one IT team member to find the median number of full-time employees (FTEs) per IT team member by company size—similar to our analysis of HRBP team size.

The findings indicate that companies tend to have a median of about 75 FTEs per IT team member. That said, the ratios vary widely from the 25th to 75th percentiles. This variance could stem from factors like IT outsourcing, IT automation tools, the complexity of the company’s tech stack, or how distributed a company’s workforce is.
Where does your IT team fall on this spectrum? Do you think it's lean, balanced, or stretched too thin?
IT Staffing Ratios by Company Size
Pave's median of 1:75 sits well above what most third-party surveys report, largely because it reflects live customer data rather than a static, point-in-time sample. For context, Indeed's own research puts the average IT staffing ratio at 1:27 across all company sizes, breaking down as follows:
The direction of that pattern holds broadly: ratios tend to loosen as companies grow, since standardized tools, self-service options, and economies of scale let each IT team member support more people. But the size of the gap between that older survey data and Pave's own real-time data, the 1:75 median is itself a useful signal about how much automation and tooling have shifted IT staffing since that kind of survey data was collected.
IT Staffing Ratios by Industry
Company size isn't the only driver. Industry matters just as much, largely based on how regulated or IT-dependent a business is. Based on industry benchmarks published by Workwize, financial services and healthcare typically run tighter ratios, often in the 1:50 to 1:100 range, given the security, compliance, and uptime demands those industries carry.
Technology and software companies typically fall in a wide 1:30 to 1:100 range, depending on how much of the company's own infrastructure the IT team supports directly. Manufacturing and retail, by contrast, often run much leaner, in the 1:200 to 1:500 range, since large parts of the workforce need only standardized, low-touch IT support.
Education often runs leanest of all, sometimes 1:300 or higher, though this is as much a reflection of budget constraints as it is standardized tech needs.
How to Calculate Your IT Staffing Ratio
The formula is simple: total employees divided by IT staff equals your ratio. A company with 1,000 employees and 20 IT staff members has a 1:50 ratio.
A "healthy" ratio isn't a single universal number. It's one that keeps ticket backlogs manageable, matches the company size and industry benchmarks above, and reflects how much of your Tier-1 support is already automated. A ratio that looks lean on paper can still work well if self-service tools and automation are absorbing a meaningful share of routine requests.
How AI Is Changing IT Staffing Ratios in 2026
AI-powered self-service and automation are already reshaping headcount in support-adjacent functions, and IT is a likely next front. Pave's own hiring data offers an early, directionally relevant signal from a closely related function: customer support hiring has fallen from 8.30% of new hires in Q4 2023 to just 2.88% in Q3 2025, a 65% decline, as AI absorbs a growing share of Tier-1 volume like password resets and routine troubleshooting.
That data point is about customer support specifically, not IT departments, but the mechanics are similar: both functions handle a high volume of repetitive, well-documented Tier-1 requests that AI tools are increasingly built to deflect.
For IT teams, that means mature adopters of AI-powered helpdesk and self-service tools may be able to run leaner than the company-size and industry benchmarks above suggest, without a corresponding drop in service quality, as long as the automation is actually handling real ticket volume rather than sitting unused.
For headcount planning, the practical takeaway is to treat today's benchmarks as a starting point, not a ceiling, and to weigh how much of your own Tier-1 volume is already automated before deciding whether your current ratio needs more heads or better tooling.
What's the Best Way to Benchmark Your IT Staffing Ratio?
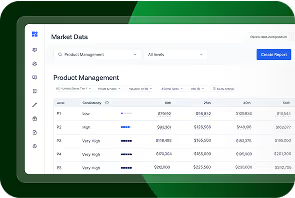
Static survey benchmarks go stale the moment they're published. Market Data Pro gives you a live, continuously updated view of headcount and compensation data instead, so you're benchmarking your IT staffing ratio against what companies are doing right now, not what a point-in-time survey captured months or years ago.
.avif)
Matt Schulman is CEO and founder of Pave, the complete platform for Total Rewards professionals. Prior to Pave, he was a software engineer at Facebook focusing on user-centric mobile experiences. A self-proclaimed "comp nerd," Matt is known for sharing data-driven thought leadership around all things compensation and personal finance.
Frequently Asked Questions (FAQs) About IT Staffing Ratios
What's the best benchmarking tool for IT staffing ratios and IT team size?
A live, continuously updated data source is a more reliable benchmarking tool than a static survey, since IT staffing ratios shift quickly as automation and AI tools mature. Pave's Market Data Pro benchmarks headcount and compensation data in real time, so you can compare your IT team's size against current market patterns rather than a point-in-time snapshot.
What is a healthy IT staff-to-employee ratio?
Pave's own data puts the median at about 1 IT team member per 75 employees, but "healthy" depends heavily on your company's size and industry. Smaller companies and highly regulated industries like financial services and healthcare typically need tighter ratios, while larger companies and less IT-dependent industries can often run leaner without sacrificing service quality.
How does the ideal IT staffing ratio change with company size or industry?
Ratios generally loosen as company size grows, since standardized tools and self-service options let each IT team member support more people. Industry matters just as much: highly regulated or security-sensitive industries like financial services and healthcare typically need tighter ratios, while manufacturing, retail, and education can often operate with far leaner IT staffing relative to headcount.
.jpg)