.avif)
Pay for performance is trending.
Google recently announced they’re moving to a pay-for-performance model and will reward top performers at higher rates. Other tech giants like Amazon and Microsoft are following suit.
It would seem that the “peanut butter” method of spreading pay increases evenly across employees is out, and compensating high performers is in.
With all this talk about pay for performance, we wanted to understand how Pave customers are implementing the strategy. We dove into our real-time dataset to gather data from 94,000 employees across 285 merit cycles, and created our cutting-edge Pay for Performance Report.
Here, we’re sharing our top four takeaways—keep reading to get the insights.
1. Organizations Use Three to Six Performance Rating Categories
Before implementing a pay-for-performance model, compensation teams must build a framework to measure employee performance.
Our data shows that performance rating scales vary by company, but most organizations generally use three to six rating categories. Smaller organizations typically have fewer rating categories, and larger, more complex companies usually use five or six buckets—sometimes even more.
Case in point? Google’s recent announcement. As part of their pay-for-performance update, they shared the five categories they’re using to measure employee performance:
- Not enough impact
- Moderate impact
- Significant impact
- Outstanding impact
- Transformative impact
2. High Performers Usually Get Pay Raises
With the infrastructure in place, let’s talk about how compensation teams put their pay-for-performance strategy into action.
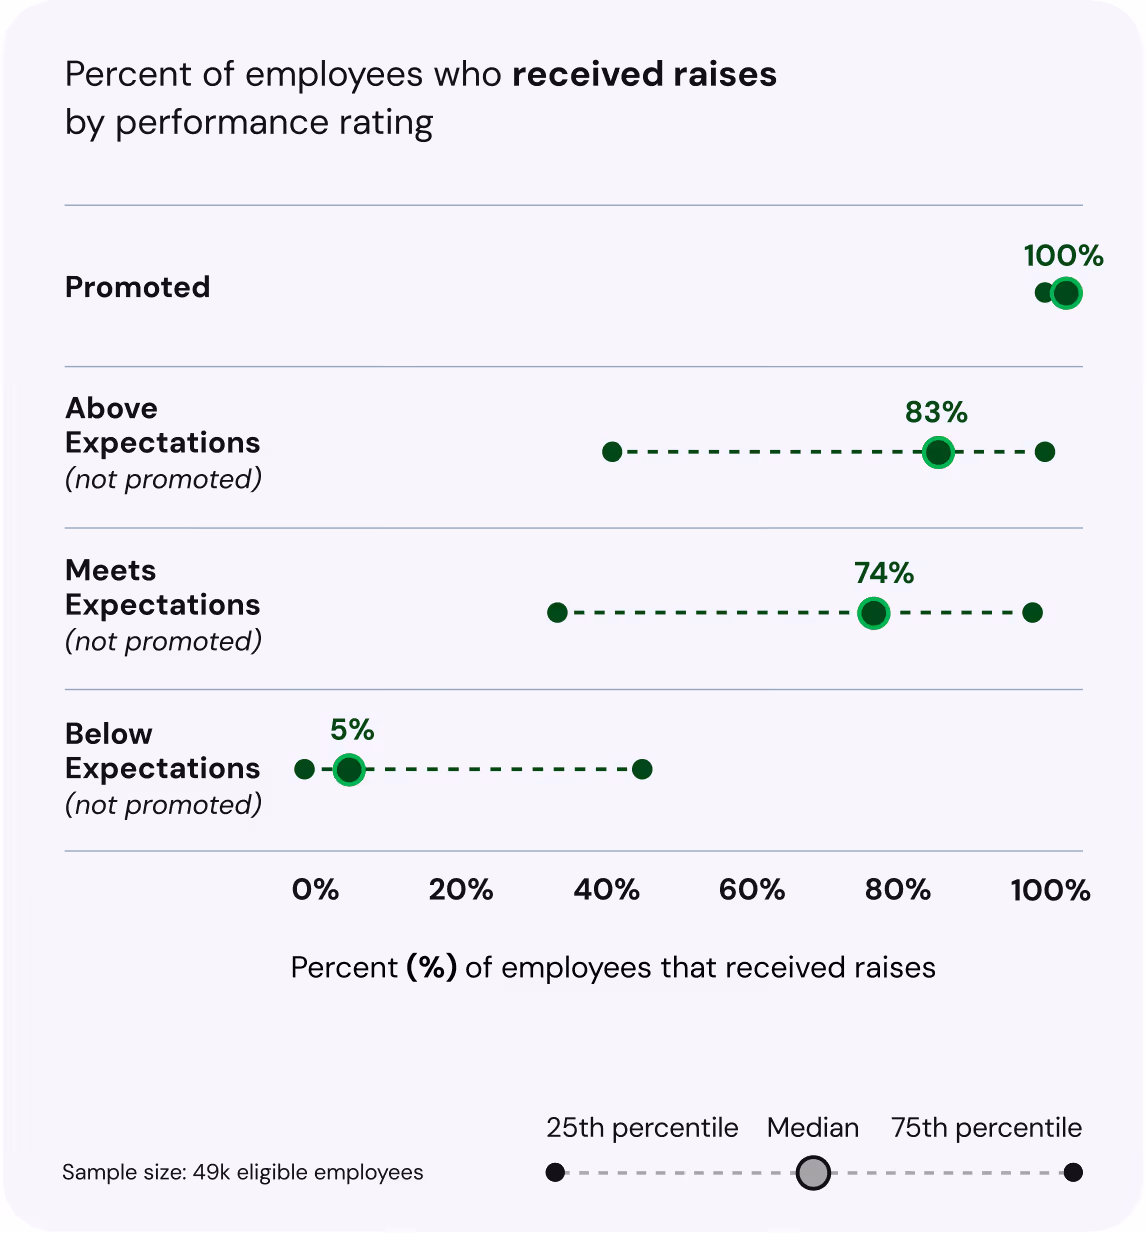
Employees who get promoted almost always get a pay raise, and typically employees who receive “meets expectations” or higher get a raise—but it’s not guaranteed.
Here’s what the data shows at the 50th percentile:
- 100% of promoted employees received a raise
- 83% of employees rated “Above Expectations” received a raise
- 74% of folks rated “Meets Expectations” received a raise
- 5% of employees rated “Below Expectations” received a raise
Want help determining and administering pay raises? Compensation leaders at companies like HubSpot and ClickUp use Pave’s compensation planning tools to run end-to-end merit cycles successfully.
3. Equity Refresh Practices Vary Widely
The higher the performance rating, the more likely employees are to receive refresh equity.
95% of employees who were promoted received equity, and 27% of employees rated “Above Expectations” were given additional equity compensation.
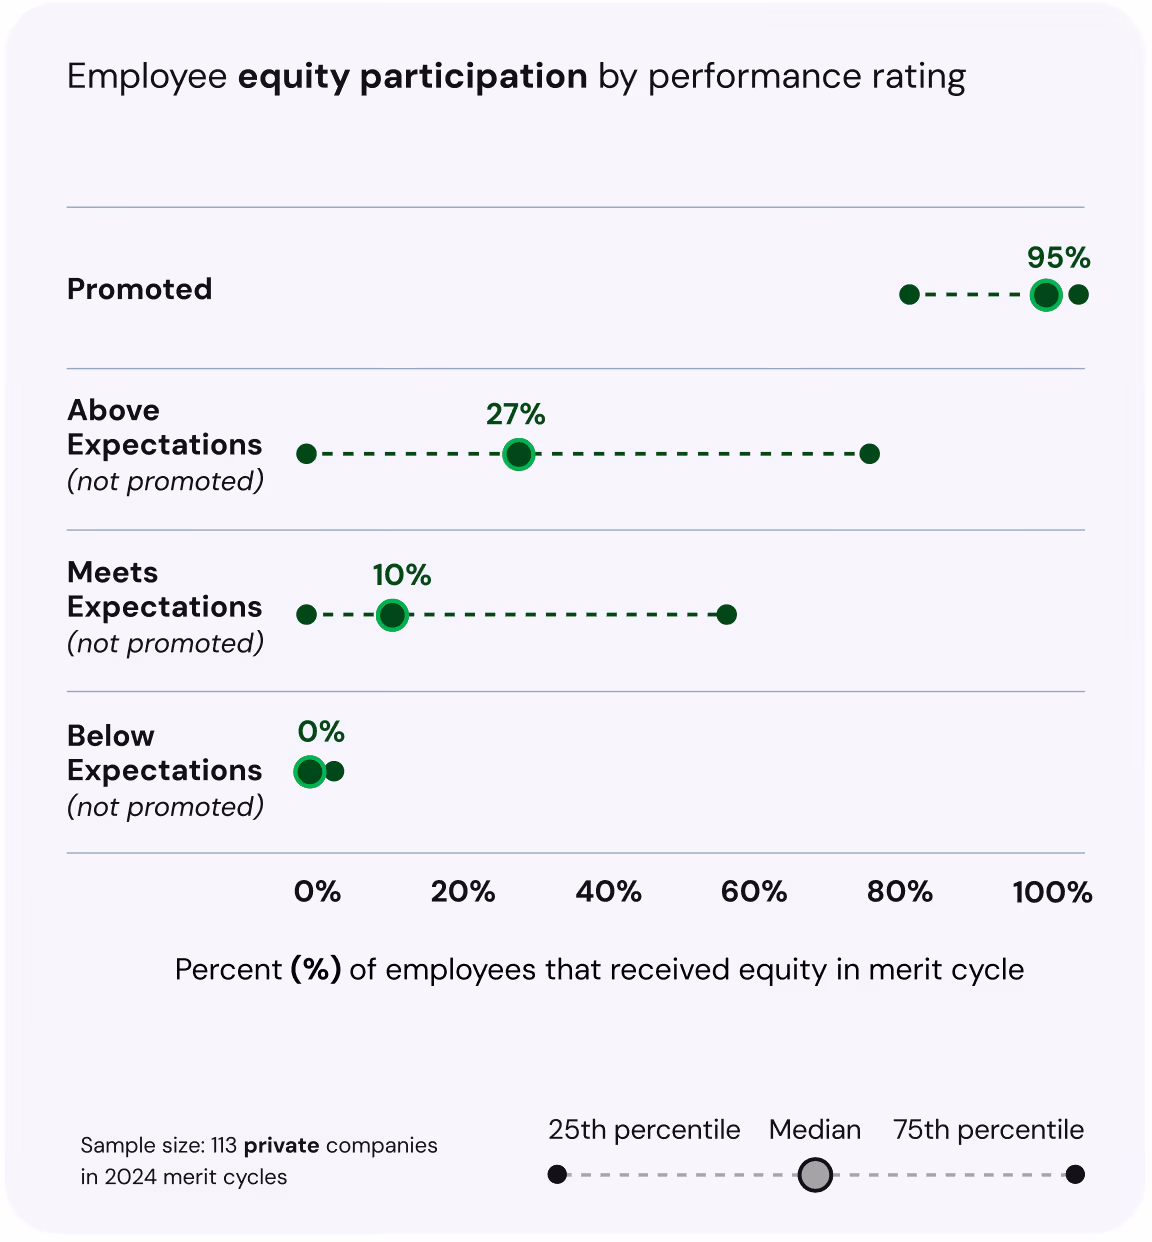
However, compared to cash, equity participation varies widely. Some organizations don’t award equity refreshes as part of a merit cycle, some give small amounts, and others lean into equity as a significant part of an employee’s merit increase package.
We’ve explored data on equity program design before, so it’s not shocking to see such variances in practices from company to company. This makes having access to reliable equity insights even more crucial. That's why we built Calculated Benchmarks—to provide more relevant, accurate, and timely equity benchmarks designed to help compensation leaders make informed decisions.
4. Raises Tend To Be Equitable by Gender
Women and men with the same performance rating tend to receive similar raise amounts. And in most cases, women receive marginally larger raises than men at the same rating level.
This indicates companies are moving towards pay equity—but the gender gap isn’t gone. The absolute value of base salaries and raises may differ, so while raise percentages are similar, total compensation can still vary.
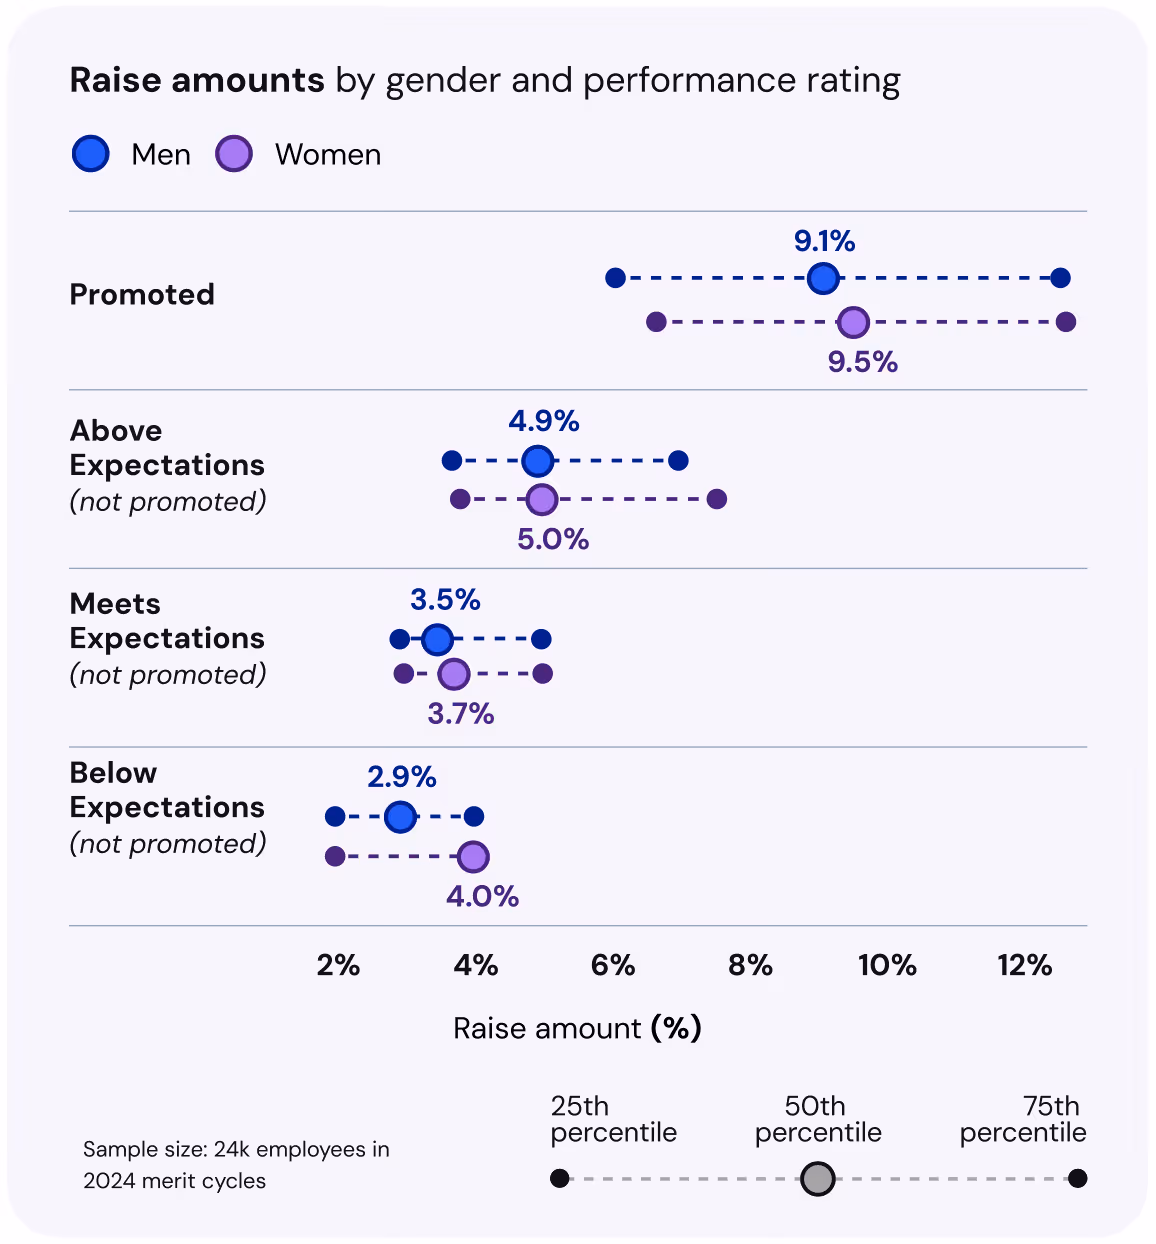
Companies are making strides towards pay equity, but there’s still work to be done.
In our recent Equal Pay Day data analysis, we found that the role-adjusted (same job family, job level, and location) gender pay gap for base salaries is 4%. This may seem like a small number, but it can have a significant impact throughout someone’s career.
Get Pay for Performance Best Practices and Trends
The data shows pay for performance is on the rise. Is your organization ready?
Download the report to learn how other companies are implementing their pay-for-performance strategy, and how you can too.
You’ll get answers to questions like:
- How many people should get promoted each year?
- Who should get more base pay? Equity?
- How much more salary should high performers get?
- And, more!

Jess is a content strategist and writer with a passion for helping small and mid-sized B2B companies tell great stories. Outside of work, Jess is an east-coaster turned west-coaster, a yoga teacher, and a fan of bad reality TV and good food.