
We often discuss annual attrition and employee turnover. Your hiring and onboarding processes play a key role—how good are they? One way to assess this is to consider the latest “12 month survivorship” benchmarks, or the percentage of new hires that make it to their one-year work anniversary.
As mathematician Edward Lorenz noted, “Small changes in initial conditions can lead to large-scale variation in future outcomes”, a phenomenon coined as the butterfly effect. For talent management, this means that nailing the initial conditions of how new hires enter your company is crucial.
So how are you doing at your hiring hit rate and onboarding success outcomes compared to the market? Let’s take a look at some benchmarks.
What are the employee tenure benchmarks by company stage?
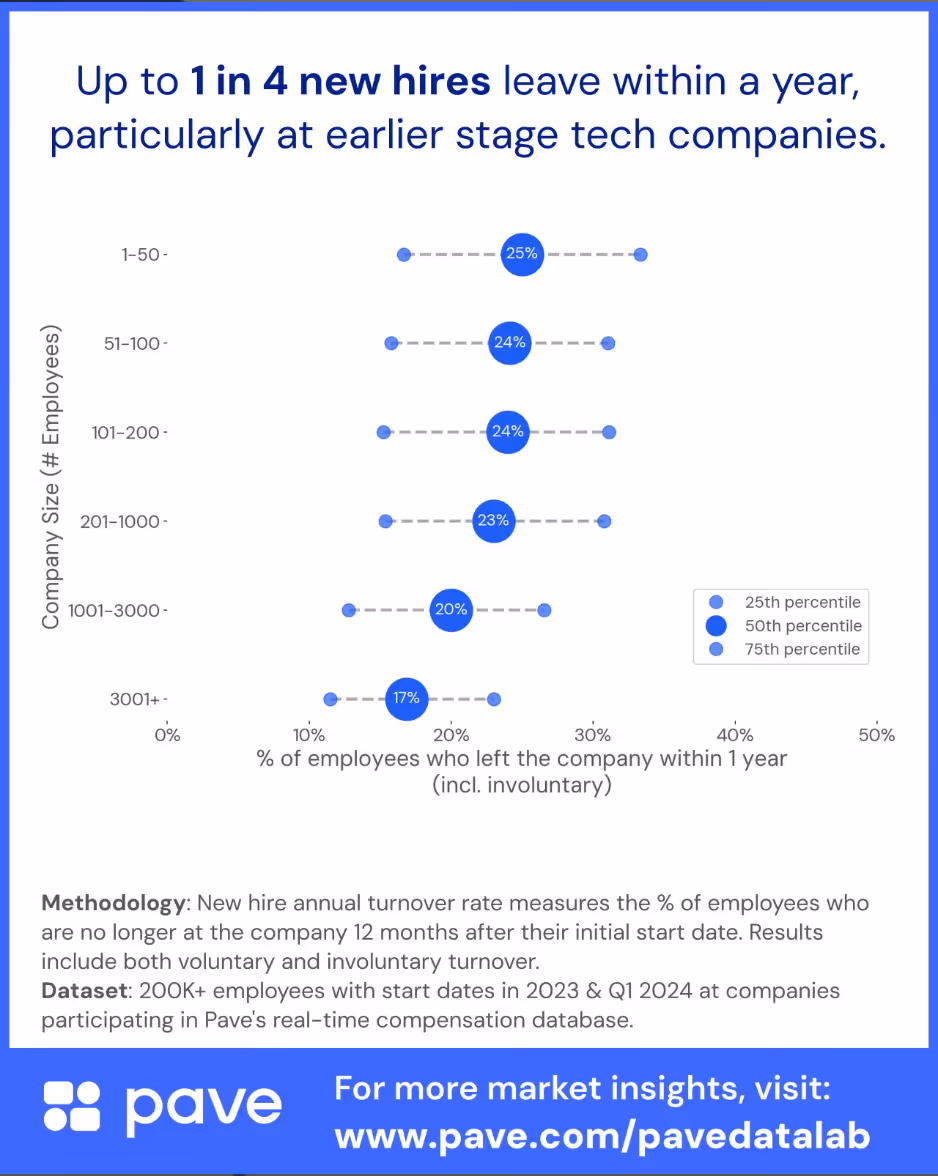
The following benchmarks are from an analysis of 200,000+ employees with start dates in 2023 and 2024 across Pave’s customer base.
When we look at company size, we see that earlier stage businesses all experience a similar trend: up to 1 in 4 new hires leave within their first year.
What are the trends in new employee tenure?
More employees survive to the one-year mark at larger companies. This is perhaps driven by more robust onboarding processes, more successful hiring patterns, and/or less of the “hire fast and fire faster” early-stage ethos. There are also likely other additional confounding variables at play.
It’s also noteworthy that the ranges from the 25th to 75th percentile are wide. For instance, at 1,000 to 3,000 employee companies, the 25th percentile is ~12% and the 75th percentile is ~27%. This suggests that there is a wide array of outcomes across the market.
Practical Suggestions for Compensation & HR Leaders
What percentage of your employees successfully make it to their one-year work anniversary? How does your figure compare with the industry benchmarks shown above?
Use this to help inform whether or not it might be useful to invest more in improvements to your hiring and/or onboarding processes. Consider ideas like structured 30-60-90 day check-ins, buddy systems, role clarity assessments, and other strategies aimed at creating stickiness within your organization.
Once employees are onboarded, their manager plays a large role as well—how does your organization’s span of control compare to the market benchmarks?
.avif)
Matt Schulman is CEO and founder of Pave, the complete platform for Total Rewards professionals. Prior to Pave, he was a software engineer at Facebook focusing on user-centric mobile experiences. A self-proclaimed "comp nerd," Matt is known for sharing data-driven thought leadership around all things compensation and personal finance.


.avif)

