
Key Takeaways
- The median HR to employee ratio at private companies with fewer than 1,000 employees is 1:38, or 2.6%, based on Pave's analysis of 3,471 companies.
- Private companies with 1,000+ employees and public companies run leaner, at a median of 1:32 and 1:33, respectively.
- The 25th to 75th percentile range is wide: private companies under 1,000 employees span from 1:26 to 1:59.
- As AI tools take on more HR operational work, these ratios are expected to trend toward the leaner end of current ranges.
HR team sizing is one of the most common benchmarking questions people and finance leaders face. Too lean and the function becomes a bottleneck. Too large, and it is difficult to defend in a budget conversation.
Pave analyzed 3,471 companies with 50 or more employees and at least one HR team member in its real-time compensation database. The data covers the full HR function, including Talent Acquisition, HR Business Partners, Compensation, Benefits, Learning & Development, and more.
What Is the HR to Employee Ratio?
The HR to employee ratio compares the number of HR professionals in an organization to the total workforce. It is expressed either as a ratio, such as 1:50, meaning one HR professional for every 50 employees, or as a percentage of total headcount.
A lower ratio indicates a higher concentration of HR staff, which may reflect a focus on employee development, complex compliance needs, or a scaling organization building HR infrastructure. A higher ratio indicates fewer HR professionals per employee, more common in larger organizations with mature systems and standardized processes.
How to Calculate the HR to Employee Ratio
Ratio formula: Number of HR employees: Total employees
Percentage formula: (Number of HR employees / Total employees) x 100
Example: A company has 15 HR team members and 500 total employees.
- Ratio: 1:33
- Percentage: (15 / 500) x 100 = 3%
Run this calculation separately for each company type bracket below to get a comparison against the right benchmark for your organization.
HR to Employee Ratio Benchmarks: The Data
The chart below shows FTE per HR team member ratios by company type, based on Pave's compensation dataset of 3,471 companies with 50 or more employees.
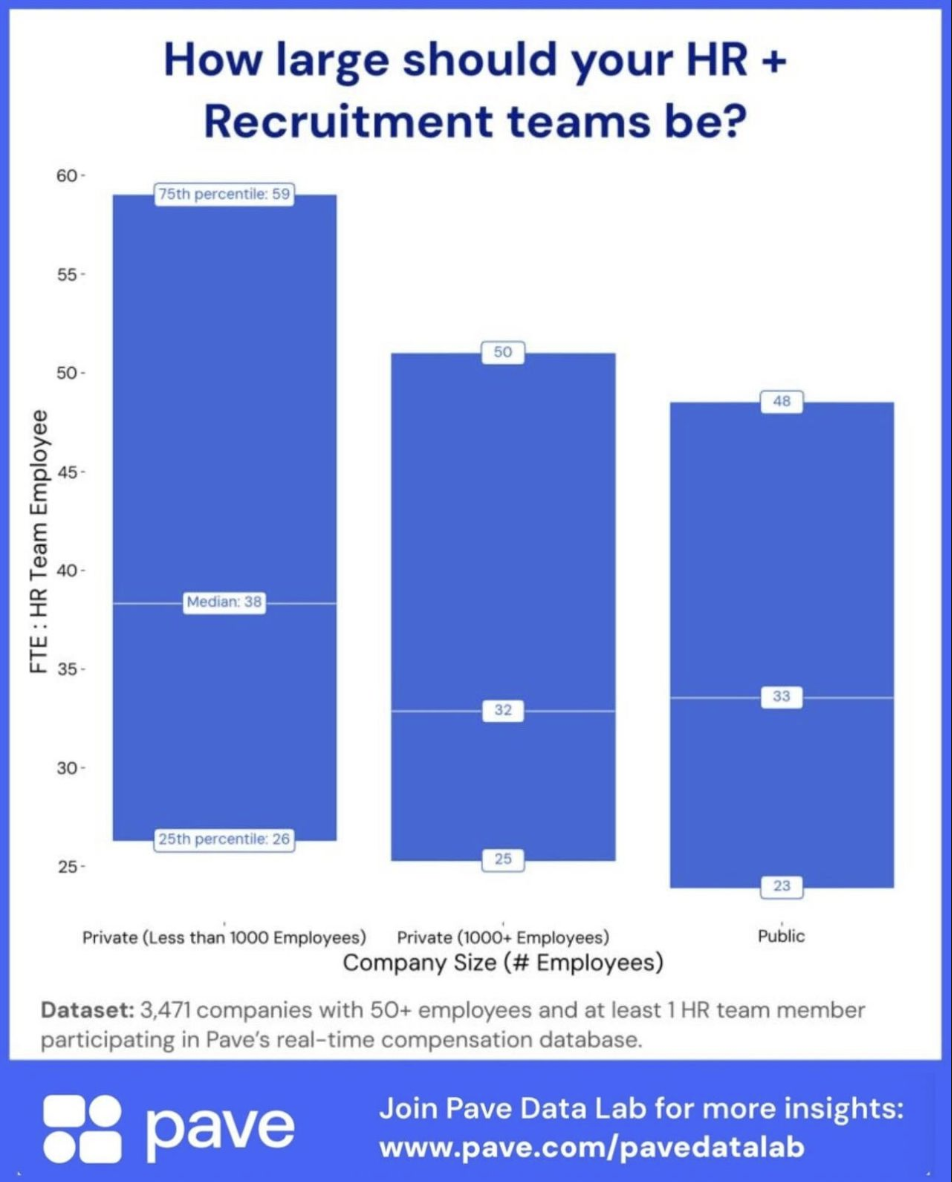
Bottom line: The median HR to employee ratio ranges from 1:32 at large private companies to 1:38 at smaller private companies. The wide percentile spread confirms there is no single right answer, but there is a defensible market range for each company type.
HR to Employee Ratio by Company Type
Private companies with fewer than 1,000 employees run the highest HR ratios: At a median of 1:38, smaller private companies carry more HR headcount per employee than larger counterparts. Scaling organizations, building HR infrastructure, managing rapid headcount growth, and standing up programs from scratch require more HR capacity per employee than maintaining a mature function at scale.
Private companies with 1,000+ employees operate at a median of 1:32: The ratio tightens as companies scale, reflecting efficiency gains from centralized operations, mature systems, and established programs that require less hands-on management per employee. The 25th to 75th percentile range for large private companies spans from 1:25 to 1:50.
Public companies run at a median of 1:33, nearly identical to large private companies: Despite additional compliance and reporting obligations, public companies absorb those demands within a ratio broadly consistent with large private peers. The bottom of the public company range reaches 1:23—lower than any other segment in the dataset—indicating that some public companies carry a notably high concentration of HR staff relative to their workforce.
What the Wide Percentile Range Tells Us
The spread from the 25th to the 75th percentile is significant across all company types. For private companies under 1,000 employees, the range spans from 1:26 to 1:59, a more than twofold difference in HR headcount for the same company size.
That variation reflects deliberate differences in HR operating models. Companies at the lean end rely more heavily on self-service tools, outsourced functions, or automated workflows. Companies at the high end have invested more in dedicated HR capacity, often in functions like Learning & Development, HR Business Partners, or Diversity & Inclusion that are not universally staffed.
As AI tools take on more operational HR work, Pave will track whether these ratios trend toward the leaner end of current ranges. The early indicators from AI's impact on the workforce suggests that operational and administrative HR roles are most exposed, while strategic and advisory functions are more durable.
Six Factors That Affect Your HR to Employee Ratio
The right ratio for your organization depends on more than headcount. These six factors determine whether your current ratio is appropriate or a signal to act.
Company Stage
Scaling organizations typically requires more HR capacity per employee. Established organizations with mature processes can often operate with leaner ratios.
Technology Adoption
Companies that have invested in HRIS platforms, automation, and self-service tools can support more employees per HR team member. Those relying on manual processes need more capacity.
HR Function Scope
Pave's benchmarks include Talent Acquisition within the HR job family. Companies that outsource recruiting or exclude it from the HR headcount will show lower ratios when compared against these benchmarks.
Workforce Complexity
Remote, distributed, or highly regulated workforces require more HR support per employee. A homogenous, single-location workforce can typically be managed with a leaner team.
Geographic Distribution
Companies operating across multiple countries carry additional compliance, employment law, and cultural requirements that increase HR capacity needs.
Growth Rate
Companies in rapid growth phases need more HR bandwidth for recruitment, onboarding, and employee relations. Stable or contracting organizations can operate leaner.
Right-Size Your HR Team With Real Market Data
A ratio at the 75th percentile isn't automatically a problem, and one at the 25th percentile isn't automatically efficient. The question is whether your current position is intentional and defensible for your company's stage. Pave's Market Data Pro gives HR and compensation leaders real-time benchmarks across team sizing, compensation, and organizational structure, so every headcount decision is grounded in what companies at your stage are actually doing.

Pave is a world-class team committed to unlocking a labor market built on trust. Our mission is to build confidence in every compensation decision.

Frequently Asked Questions
What is the ideal HR to employee ratio?
Based on Pave's analysis of 3,471 companies, the median HR to employee ratio is 1:38 (2.6%) for private companies under 1,000 employees, 1:32 (3.1%) for private companies with 1,000 or more employees, and 1:33 (3.0%) for public companies. These benchmarks include Talent Acquisition within the HR function.
How many HR staff do you need for 100 employees?
At the median ratio for private companies under 1,000 employees (1:38), a 100-person company needs approximately 3 HR team members. The market range based on Pave's 25th to 75th percentile data is 2 to 4.
How many HR staff do you need for 1,000 employees?
At the median ratio for private companies with 1,000 or more employees (1:32), a 1,000-person company needs approximately 31 HR team members. The market range based on Pave's 25th to 75th percentile data is 20 to 40.
Does HR to employee ratio change with company size?
Yes. Pave's data shows the ratio compresses as companies scale. Smaller private companies run at a median of 1:38, while larger private and public companies run at 1:32 and 1:33, respectively.
What HR functions are included in Pave's benchmarks?
Benefits, Compensation, Diversity & Inclusion, Employee Relations, HR Generalist, HR Analytics, HR Business Partner, HR Operations, HRIS Operations, Learning & Development, Stock Plan Administration, Talent Acquisition, Total Rewards, and Workplace. Companies that exclude recruiting from their HR headcount will show different ratios when compared to these benchmarks.