

Compensation professionals have long asked what total pay truly looks like from the employee’s perspective.
Base salary and bonuses are straightforward, but equity is more complex. Employees typically reference what vested and appeared in their paycheck or W-2, not the original grant. Traditional equity benchmarking often focuses on what was granted, not what was realized.
While this perspective helps with program design, it requires compensation teams to create their own analyses when explaining total pay, defending offers, or explaining why a seemingly competitive package may not resonate with employees.
The challenges of benchmarking employee equity
Equity programs differ significantly. Some companies offer large, front-loaded new-hire grants, while others provide smaller, ongoing refreshes. Two employees may receive similar grants but vest very different amounts in a year. Using a single grant-based figure can obscure these differences and make distinct programs appear identical.
Market volatility increases these gaps. Fluctuating stock prices widen the gap between what was granted, what vests, and what employees perceive as value. Compensation leaders face tougher questions from executives, candidates, and employees, and grant-only benchmarks don't provide enough answers. As a result, teams often resort to custom analyses or ad hoc spreadsheets.
What's new from Pave
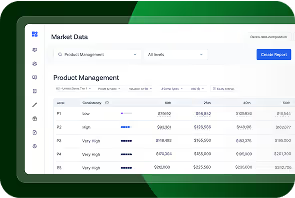
Total Direct Comp (TDC) in Market Data Pro provides an equity view based on what employees actually receive: the total value of shares vested over the past 12 months from all grants, valued at the grant date. Some people call this the "W-2 view" of equity.
We developed TDC after consulting with compensation leaders about practical pay comparisons. They indicated the need for multiple equity perspectives because practices vary across companies and stages. TDC offers a view that aligns with how employees experience their pay and complements existing grant-based analyses.
How teams can use it
- Evaluate offers and packages based on what employees at peer companies actually realize, not just what is awarded.
- Clearly communicate total pay to executives, managers, and employees using familiar terms.
- Identify discrepancies between a competitive grant and a package that remains competitive over time, particularly in changing markets.
- Ground equity discussions on aggregate market data instead of individual anecdotes.
One employee, three answers
Meet Alex, a hypothetical software engineer. Alex earns a $125,000 base salary, with no variable pay. Alex has also received three equity grants, each worth $100,000 at grant date and each vesting over four years: one in July 2024, one in April 2025, and one in April 2026.
So what is Alex’s total direct comp for the 12 months ending December 2026? It depends on how you value the equity.
- TDC on total granted: $225k. Base salary plus the full $100k April 2026 grant, the only grant made in the window.
- TDC on annualized grants: $150k. Base salary plus one year’s worth of that same grant ($100k ÷ 4 = $25k).
- TDC on total vested: $191.7k. Base salary plus $25k vested from the 2024 grant, $25k from the 2025 grant, and about $16.7k from the first eight months of the 2026 grant.
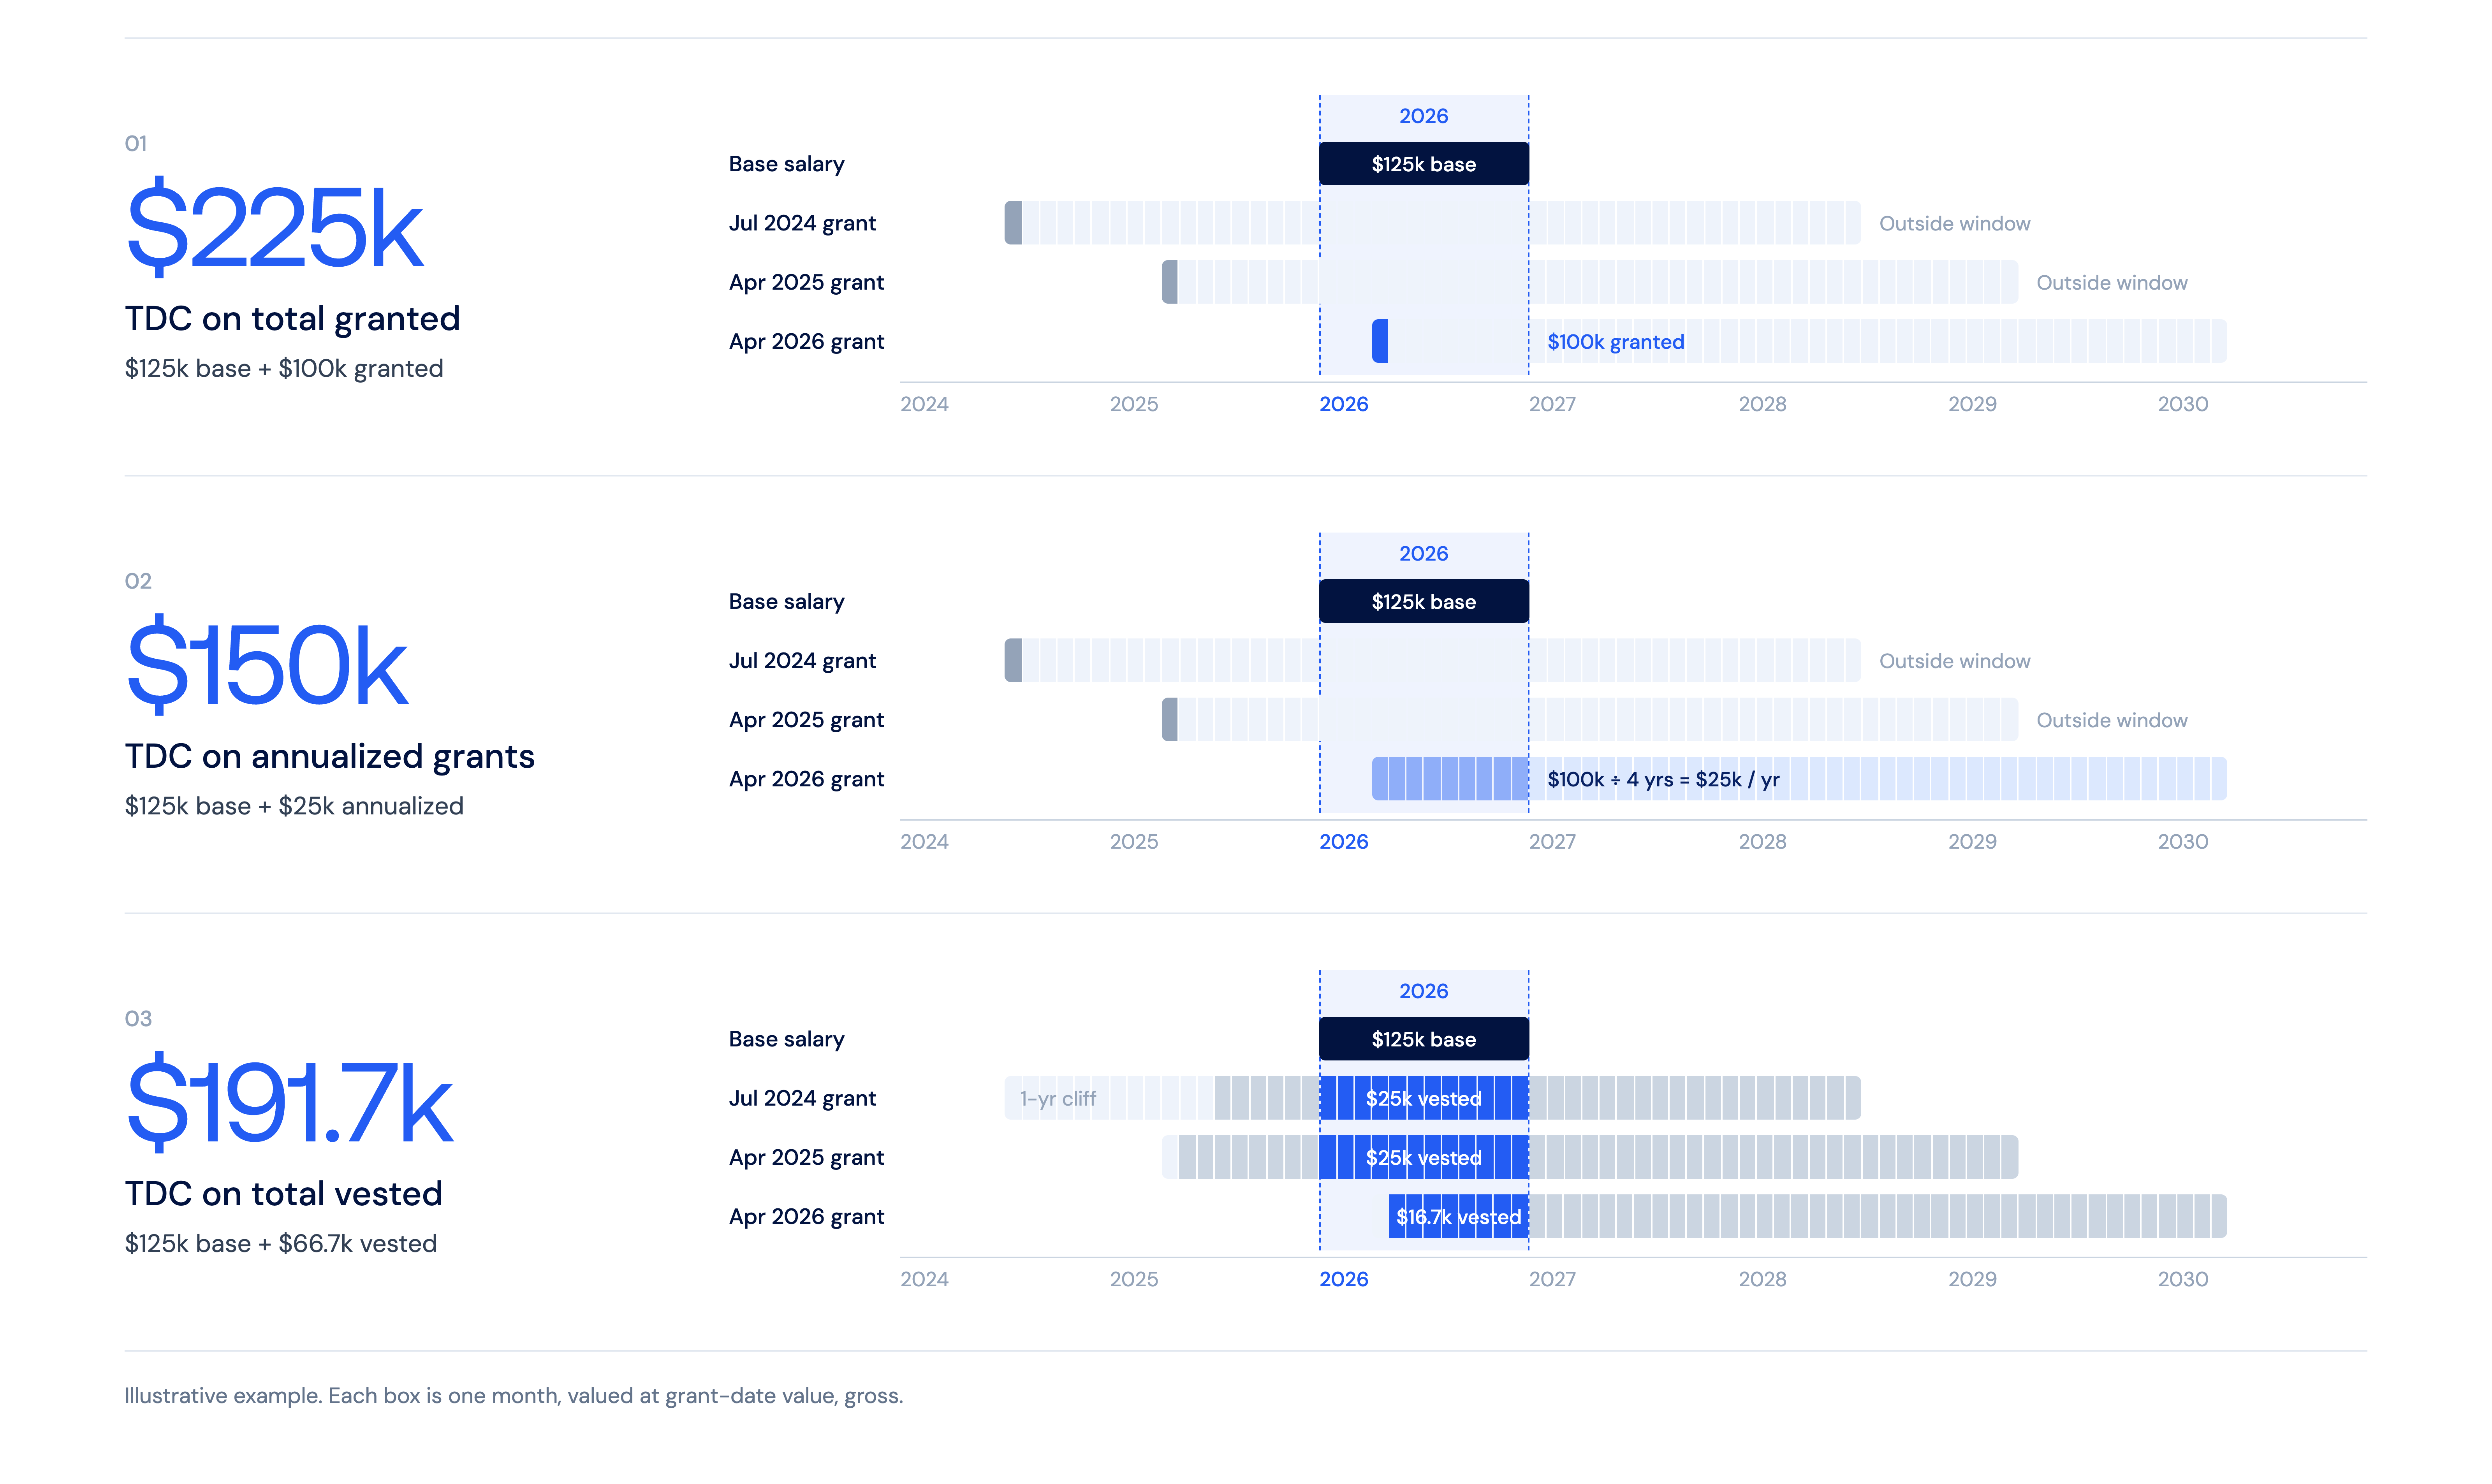
Same person, same salary, same grants, and TDC ranges from $150k to $225k. None of the numbers is wrong. They answer different questions:
- Granted shows what the company offered this year. It’s the largest number because the full multi-year grant counts in year one.
- Annualized shows the yearly value of this year’s grant.
- Vested shows what Alex actually received across every grant. It’s the view closest to how Alex thinks about pay.
Notice that the two grant-based views never see Alex’s 2024 and 2025 grants, even though those grants are still paying out. In a year with no new grant, Alex wouldn’t appear in either grant-based view at all, while equity keeps vesting. The vested view captures it.
What TDC is, and isn't
TDC is an aggregate market benchmark that highlights patterns across companies without disclosing individual employees or contributors. Because values are calculated at the grant date, TDC reflects the value of vested shares at grant, not their current worth. This approach provides a consistent basis for comparison and serves as a diagnostic tool to inform, rather than dictate, decisions.
TDC is now available Market Data Pro. To see it for yourself, request a demo.

Charles is a member of Pave's marketing team, bringing nearly 20 years of experience in HR strategy and technology. Prior to Pave, he advised CHROs and other HR leaders at CEB (now Gartner's HR Practice), supported benefits research initiatives at Scoop Technologies, and, most recently, led SoFi's employee benefits business, SoFi at Work. A passionate advocate for talent innovation, Charles is known for championing data-driven HR solutions.