

Manufacturers had 594,000 open jobs in September 2026, up 53% from 388,000 a year earlier, according to the most recent Bureau of Labor Statistics reporting. That one sector accounts for roughly 73% of the year-over-year growth in private-sector openings.
If you hire engineers, quality leads, or supply chain professionals, the key question is whether your compensation aligns with current market conditions.
Manufacturing job openings outpace other major sectors
The openings rate, which is job openings as a percent of employment plus openings, rose from 3.0% to 4.5% in manufacturing over the course of 2026. A year ago, the sector sat 1.3 points below the 4.3% all-industry rate; today it matches the 4.5% all-industry rate. Durable goods drove most of the gain.
For comparison, total private-sector openings increased by about 4% during the same period. Only construction, at 49%, grew similarly.
The primary challenge continues to be hiring
While the number of openings might suggest high turnover, quits data indicates otherwise. Manufacturing's quits rate was 2.0% in August 2026, 0.7 points below the 2.7% private-sector rate, even after increasing from 1.6% in July.
Employers are posting significantly more roles, yet relatively few manufacturing workers are leaving. This increases pressure on new-hire offers. Relying on last year's compensation data risks losing candidates, while offering higher pay to attract talent may create pay compression among existing employees.
Note that openings represent demand, not actual hires, and do not explain the increase. Use this data to review your market position, not as evidence of a specific cause.
What it costs to hire at the top of the market
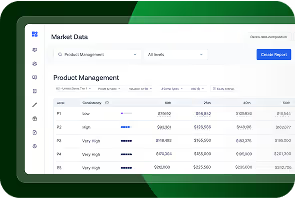
Pave market data illustrates this pressure in base pay. Across 50 job family and level combinations for manufacturing-critical roles, reaching the 75th percentile (P75) of base pay requires a median increase of 14.8% over the median (P50). This difference is the hiring premium: (P75 − P50) ÷ P50.
The hiring premium varies by level. It is highest at entry and early management levels: Supply Chain P1 is 26.3%, Supply Chain M3 is 26.1%, and Quality Assurance P1 is 24.6%. In Manufacturing Engineering, P2 is 20.0%, with a median base of $100,000 and a P25–P75 range of $85,000 to $120,000.
Pay for Manufacturing Engineering also sits below its engineering peers at higher levels. At P2 the three families are closely aligned, and all three top out at $120,000. At P4, the median base is approximately $160,000, compared to $182,000 for Electronic Engineering and $176,000 for Mechanical Engineering. At M5, it is $200,000 to $261,875, compared with $207,000 to $282,459 and $223,907 to $289,661.
4 checks before your next manufacturing offer
- Benchmark against the current market. Compare your engineering, quality, and supply chain salary ranges with up-to-date benchmarks, not last year's survey, to assess your offers accurately.
- Review the specific levels at which you hire. The hiring premium is greatest at P1–P2 and M3–M4 in several job families, so averaging across levels may obscure areas of greatest exposure.
- Set your compensation targets intentionally. If attracting candidates requires offers near the 75th percentile, make this a deliberate role- and level-based decision, rather than relying on exceptions. Use Pave Agent to model the impact of a P75 offer for roles such as P2 Manufacturing Engineer on your budget and current employees.
- Assess internal equity before increasing offers. Ensure comparable employees in the same role are paid similarly, so new hires don’t surpass those already performing the work.
Pave Market Data provides real-time data for the first two checks, with transparent methodology and confidence levels for each figure, enabling you to support your decisions. The Pave Agent, your AI compensation analyst, turns this data into on-demand recommendations, letting you move from benchmarking to a defensible offer range in minutes.

Charles is a member of Pave's marketing team, bringing nearly 20 years of experience in HR strategy and technology. Prior to Pave, he advised CHROs and other HR leaders at CEB (now Gartner's HR Practice), supported benefits research initiatives at Scoop Technologies, and, most recently, led SoFi's employee benefits business, SoFi at Work. A passionate advocate for talent innovation, Charles is known for championing data-driven HR solutions.